Statistics
Learn and practice identifying statistical questions, measuring variability and making predictions from sample data with interactive resources from GeoGebra.
Middle School
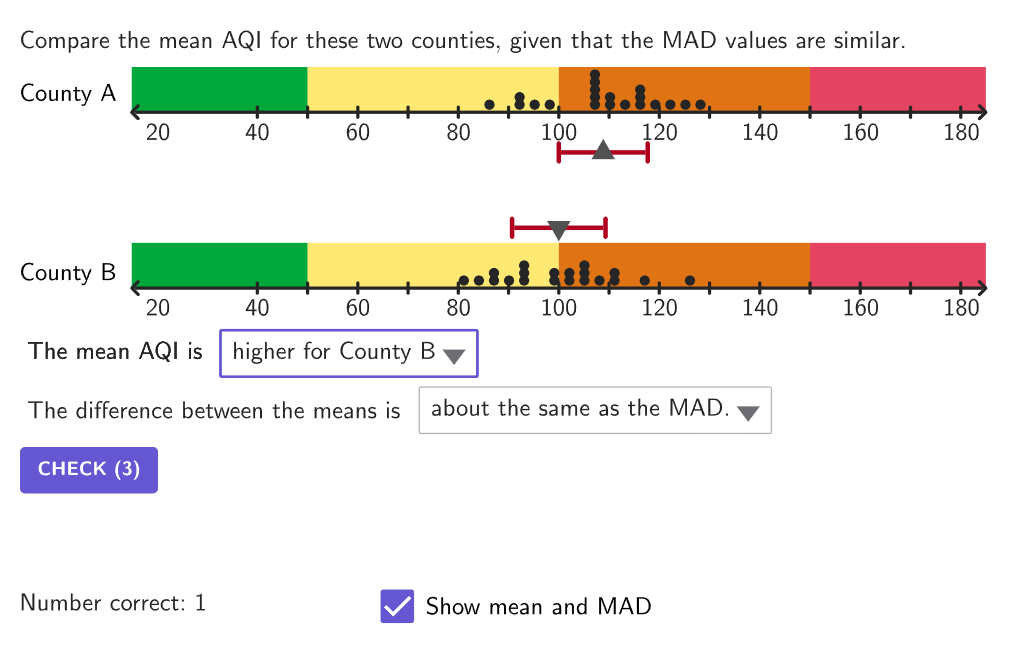
GRADES 6-8Comparing Data Distributions
Compare data and distributions of data, numerical and contextual, to draw conclusions, considering the measures of center and measures of variability.
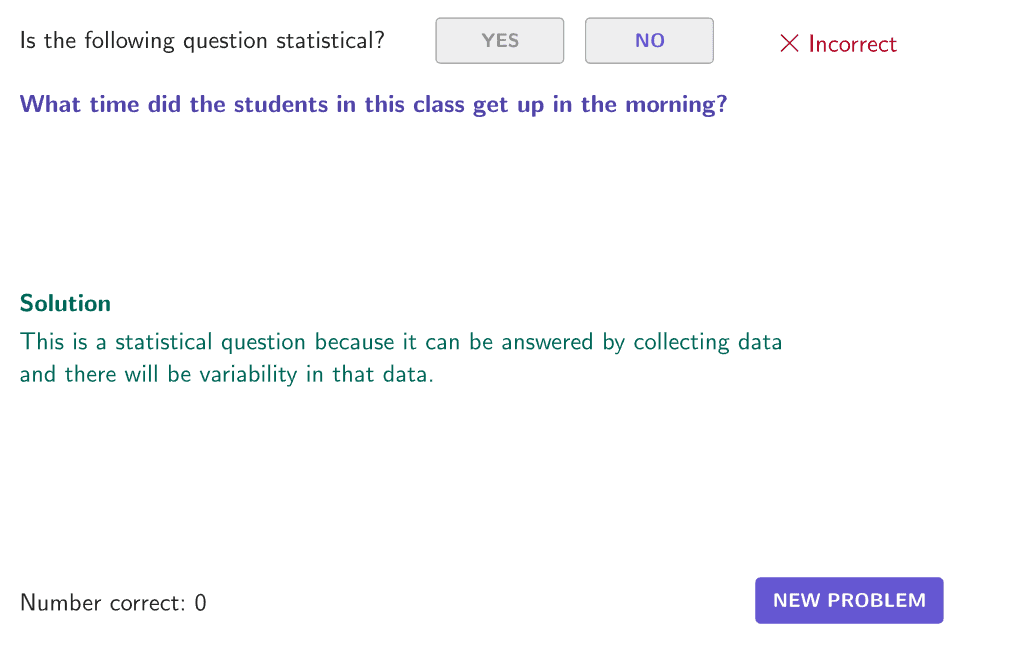
Identifying Statistical Questions
Recognize that a statistical question is one that will require gathering data that has variability.
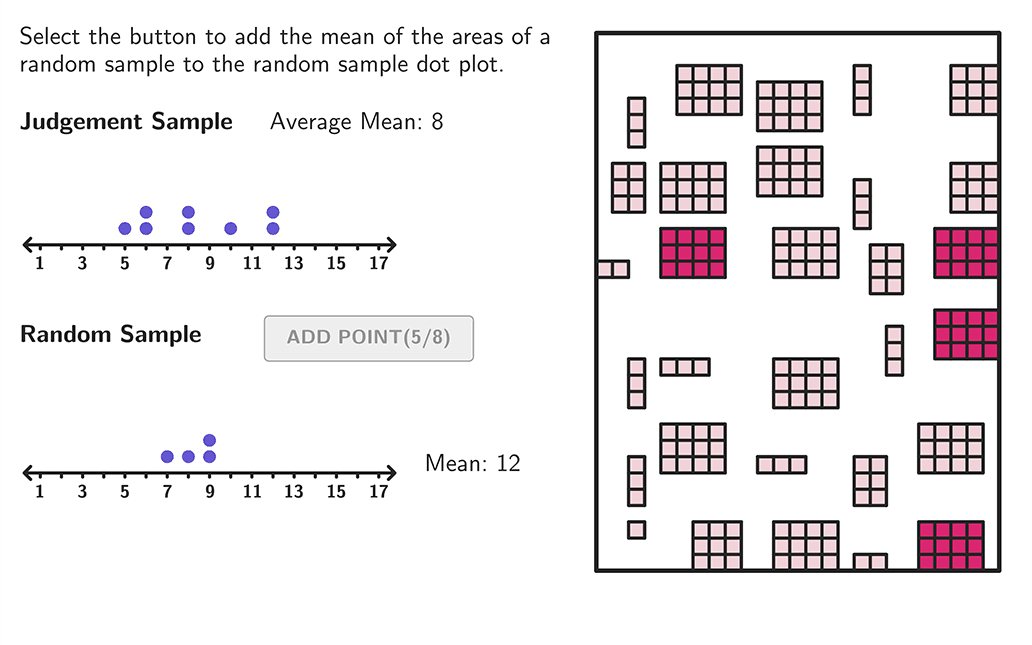
Inferences From Samples
Make inferences about a population based on a sample and compare variation in multiple samples.
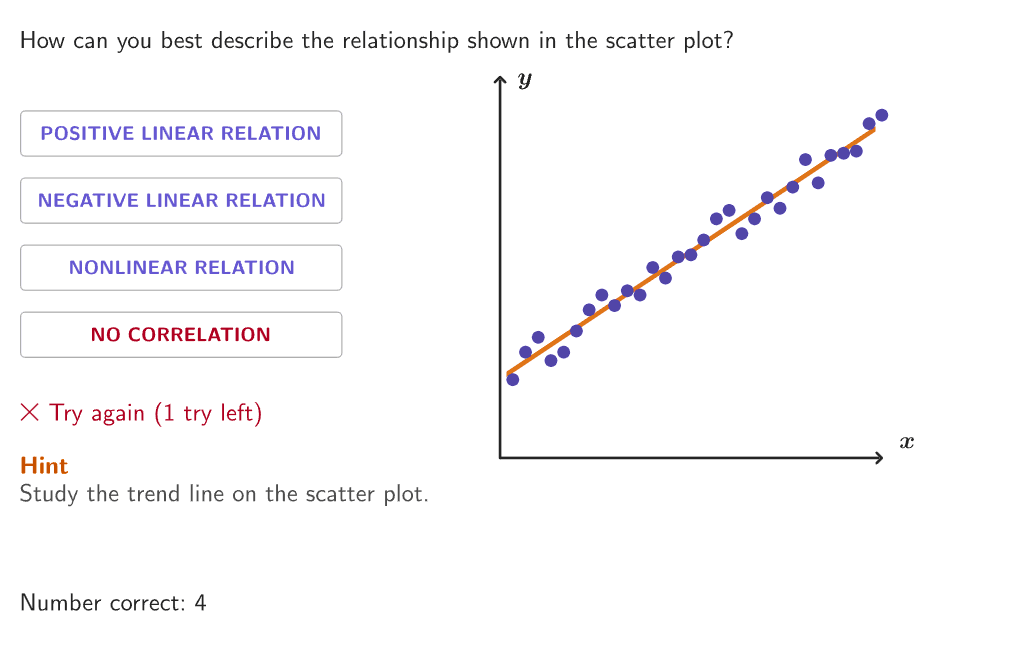
Linear and Nonlinear Relationships in Data Sets
Identify linear and nonlinear relationships in data sets.
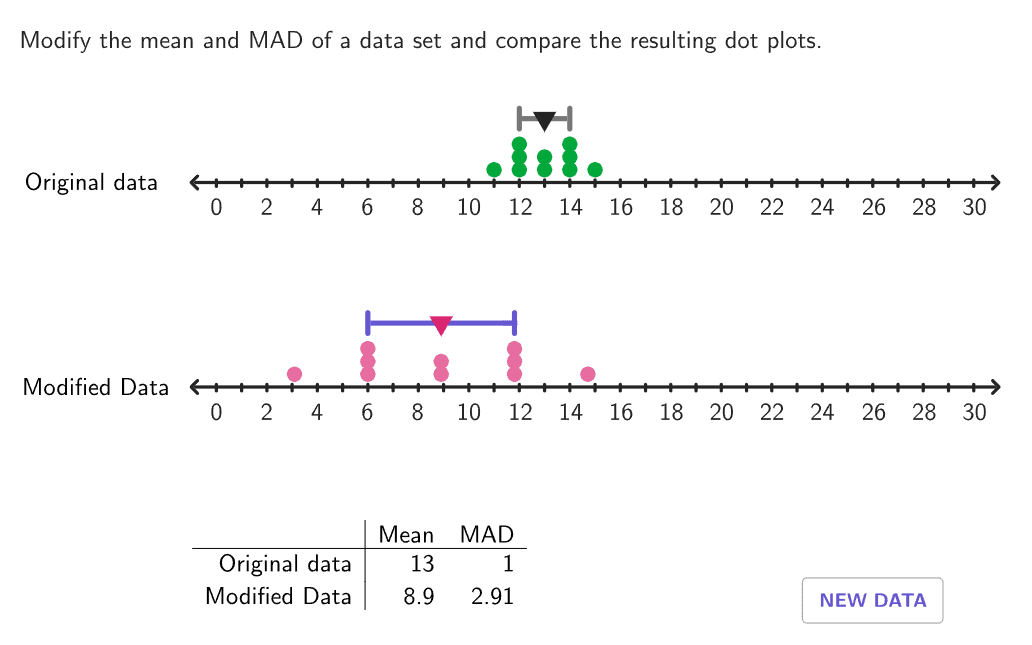
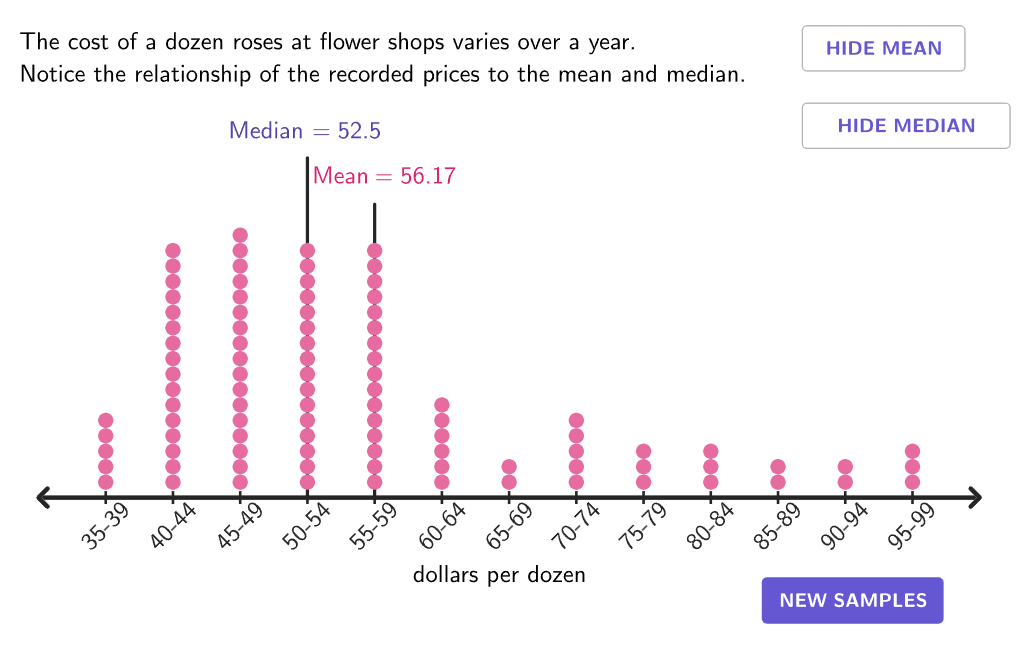
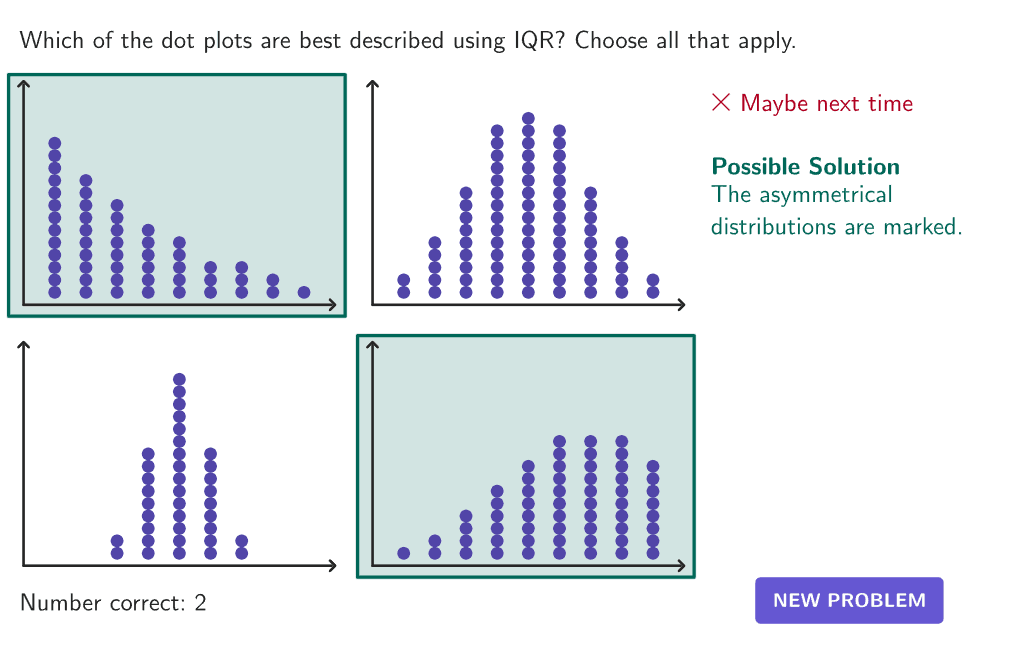
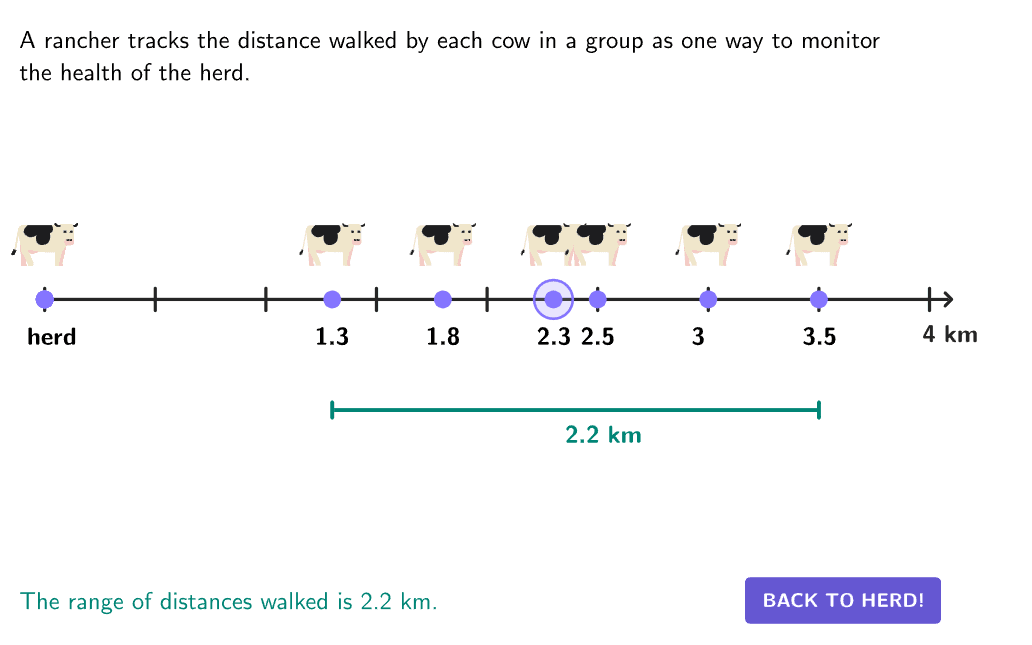
Measures of Variability
Select the appropriate measure of variability; choose a measure of variability based on the presence of outliers, clusters, and the shape of the data distribution.
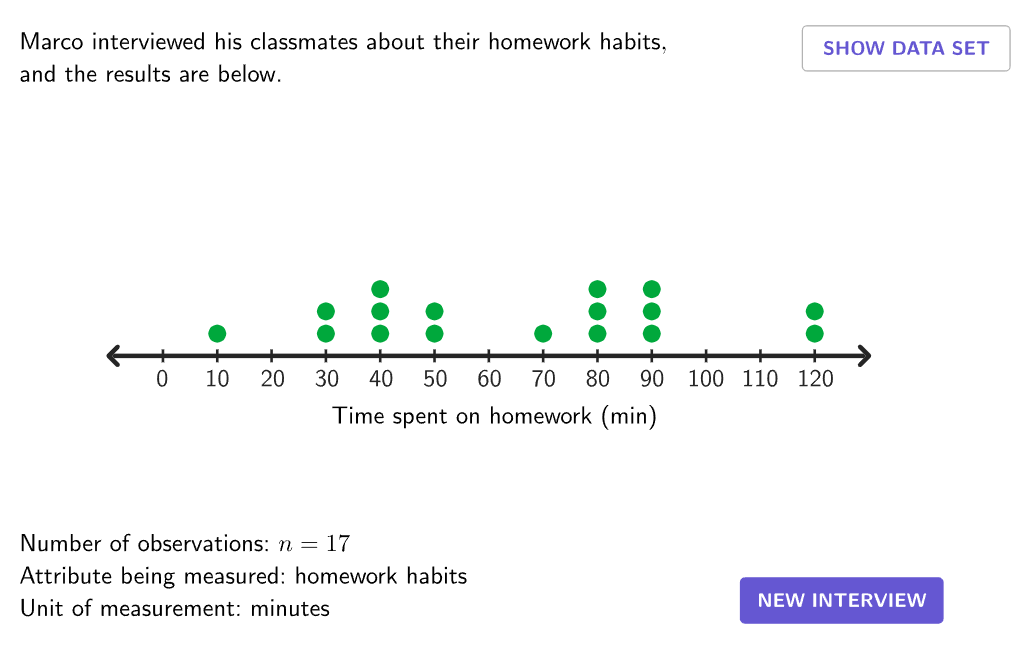
Observation, Measurement, and Sampling
Describe a data set by its number of observations, what is being measured, and the units of measurement.
Population vs. Sample
Distinguish between a population and a sample and draw conclusions about the sample (random or biased).
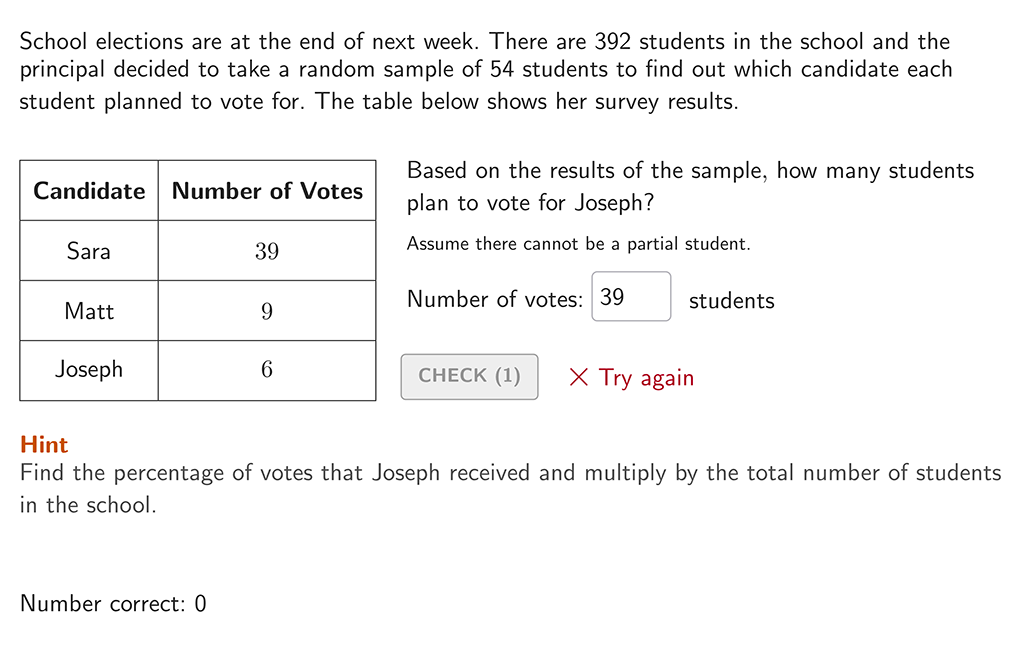
Predictions From Samples
Make predictions based on results from surveys and samples.
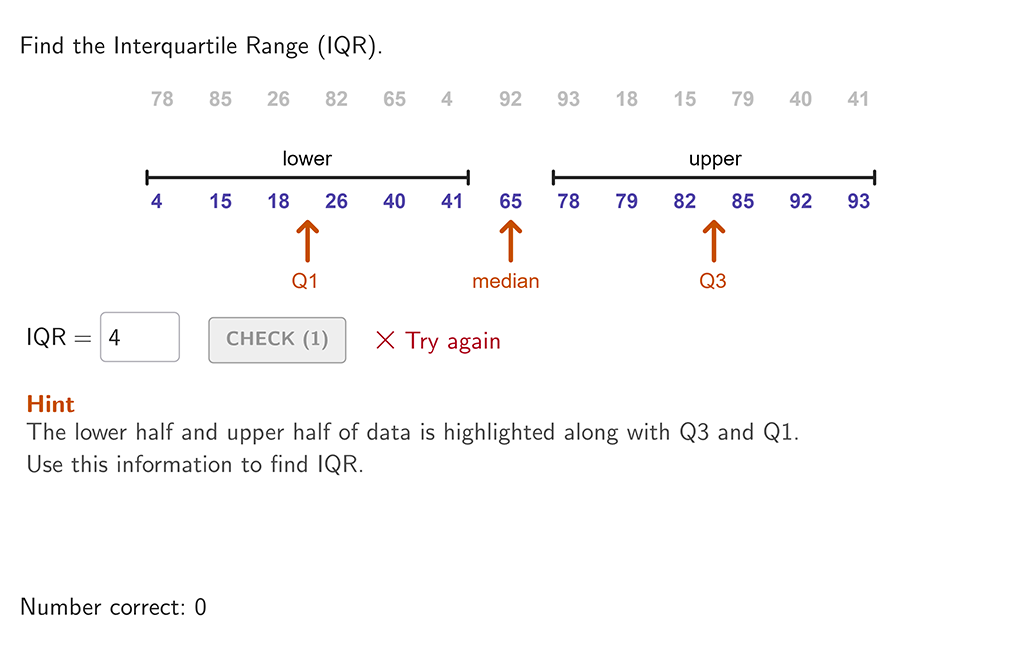
Quartiles and Interquartile Range of Data
Determine the quartiles or interquartile range for a set of data.
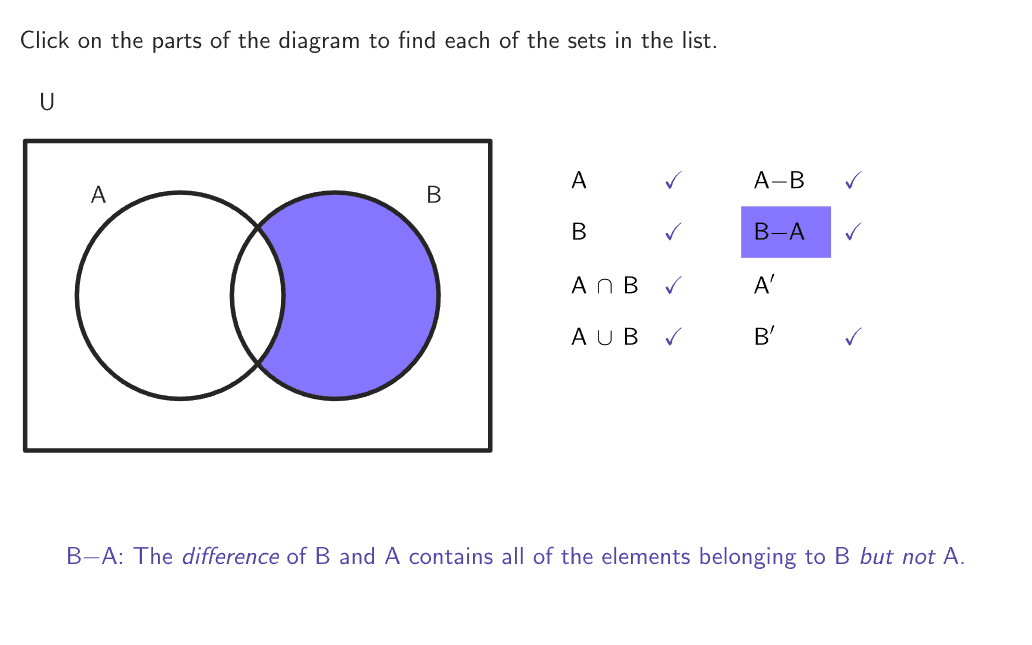
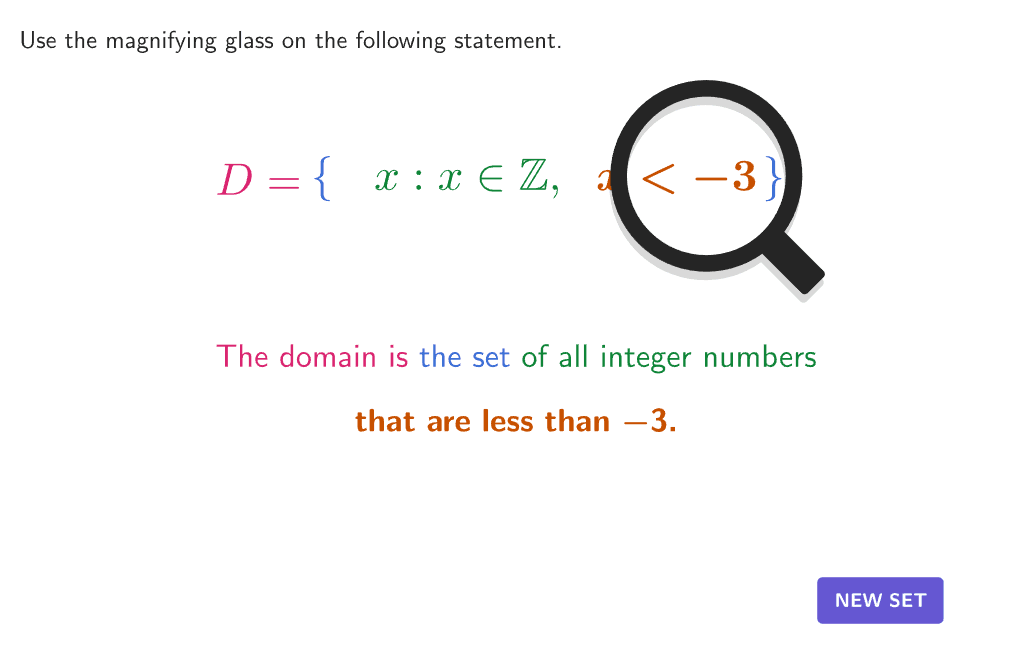
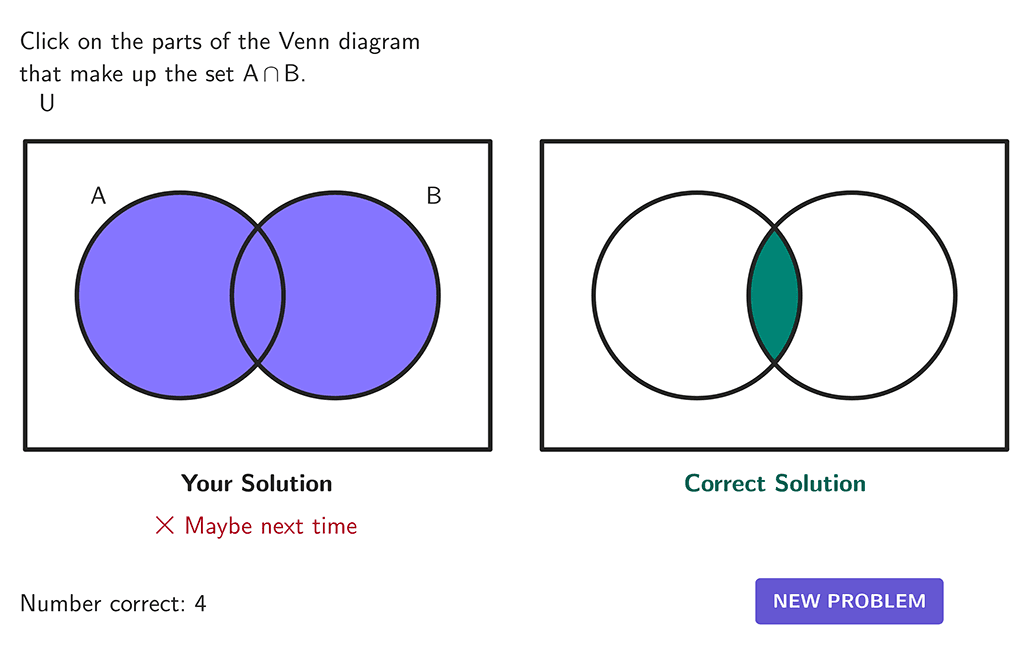
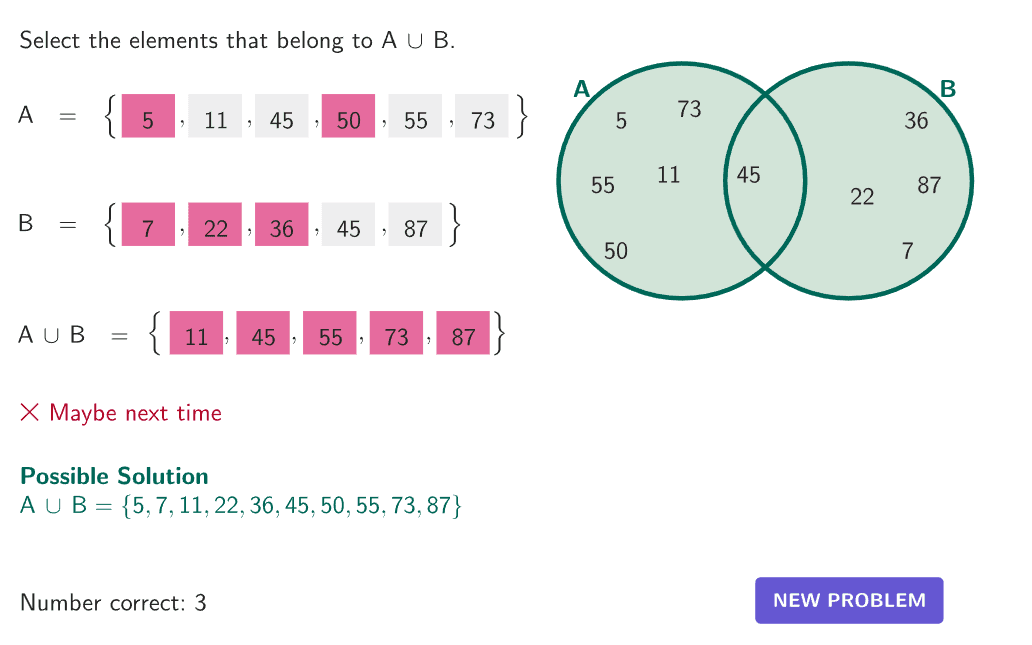
Set Theory
Use set notation to describe domains, ranges, intersection, and union of sets. Identify cardinality of sets, equivalent sets, disjoint sets, complement, or subsets.
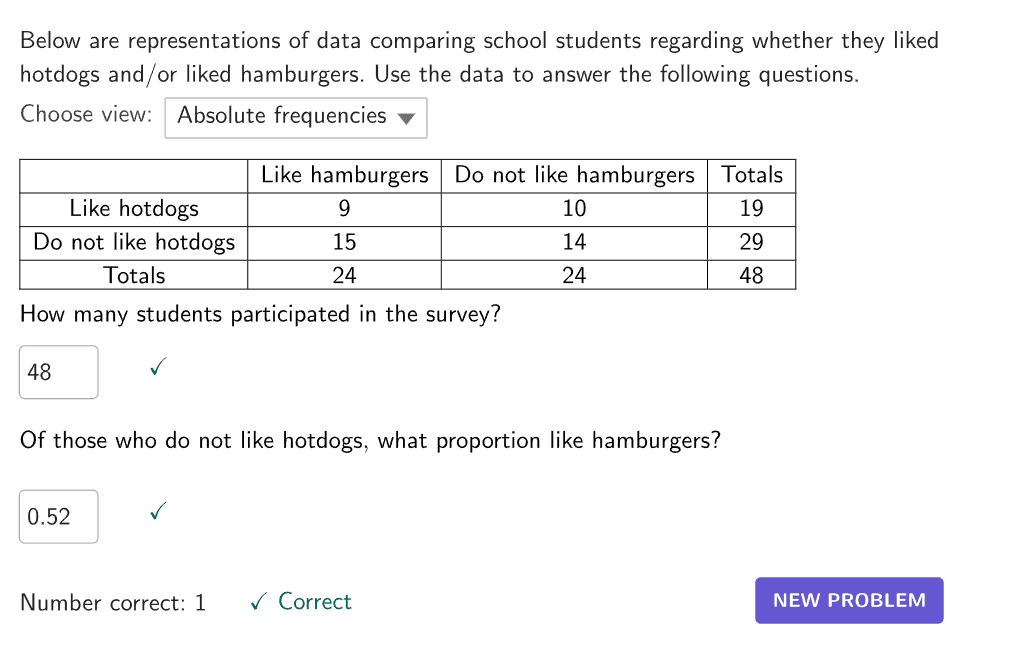
Two-way tables
Construct and interpret a two-way table to display two categories of data from the same source.
関連トピック

今すぐGeoGebraの使用を開始
無料アカウントを作成すると、いつでも進捗状況を保存したり、何千もの数学教材にアクセスしてカスタマイズしたり、他の人と共有したりすることができます。