Statistics
Learn and practice identifying statistical questions, measuring variability and making predictions from sample data with interactive resources from GeoGebra.
Middle School
GRADES 6-8
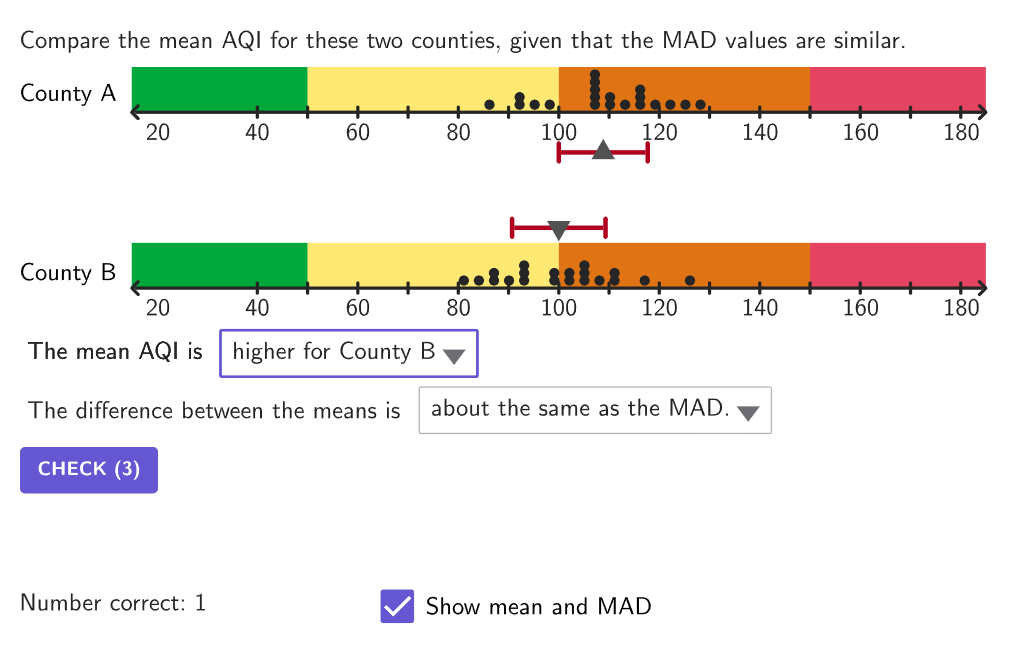
Comparing Data Distributions
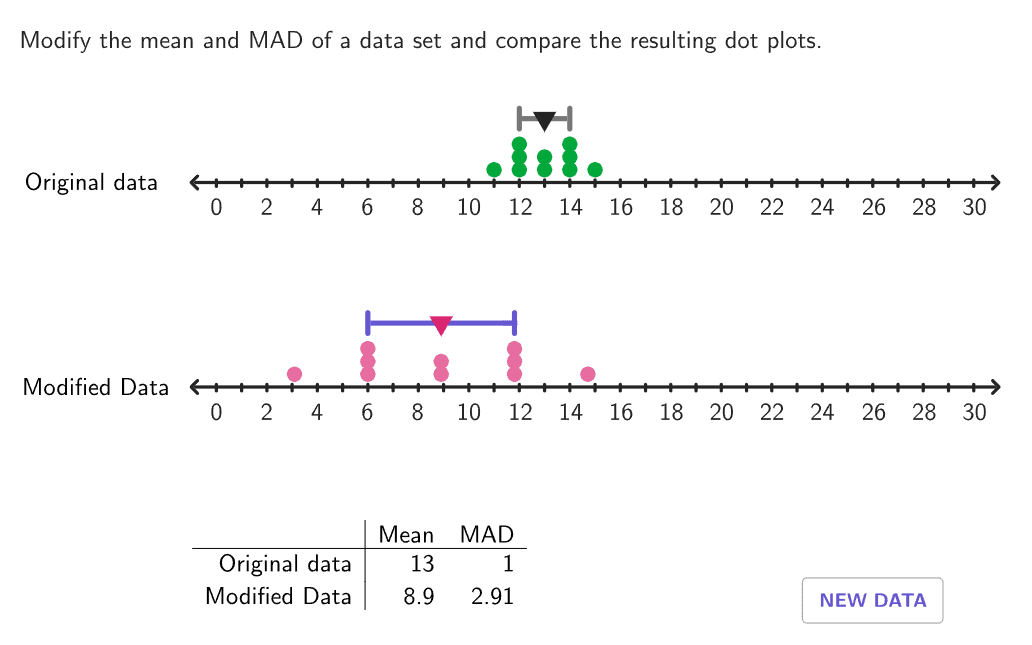
Compare data and distributions of data, numerical and contextual, to draw conclusions, considering the measures of center and measures of variability.
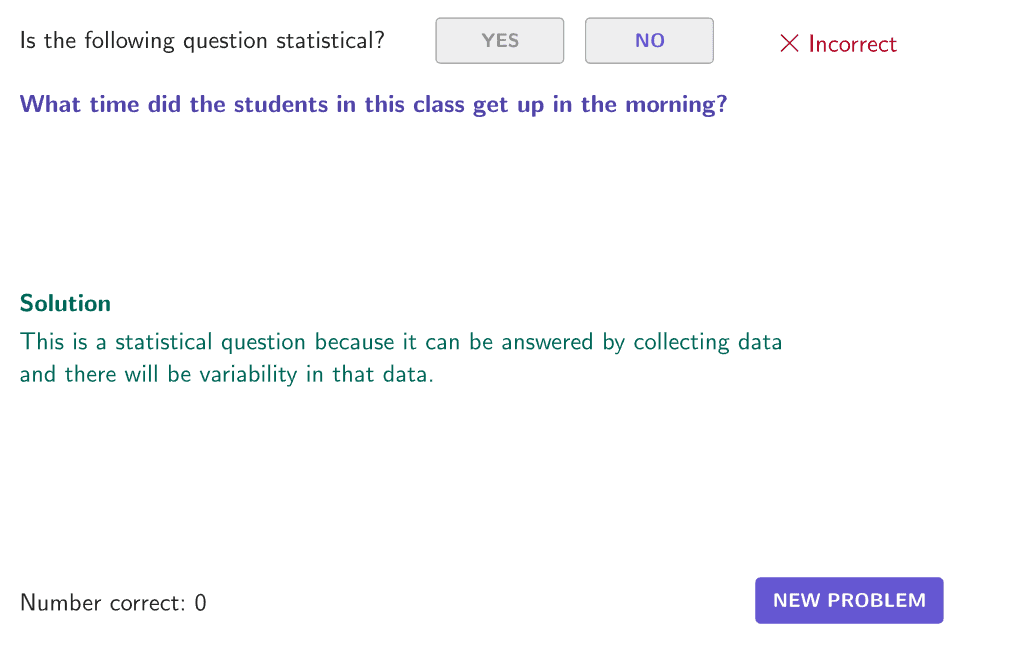
Identifying Statistical Questions
Recognize that a statistical question is one that will require gathering data that has variability.
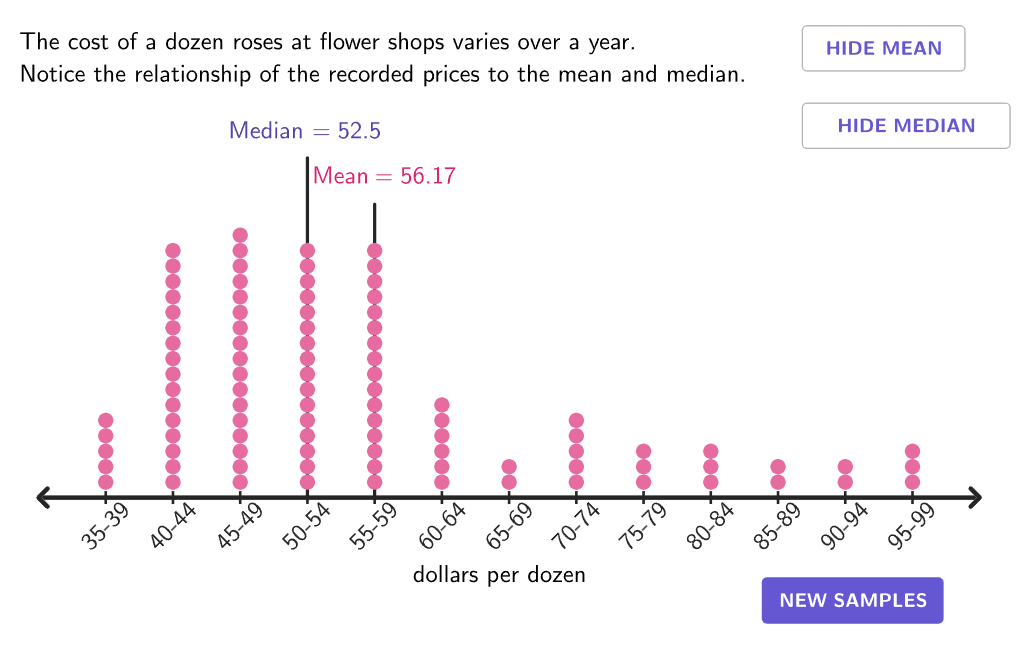
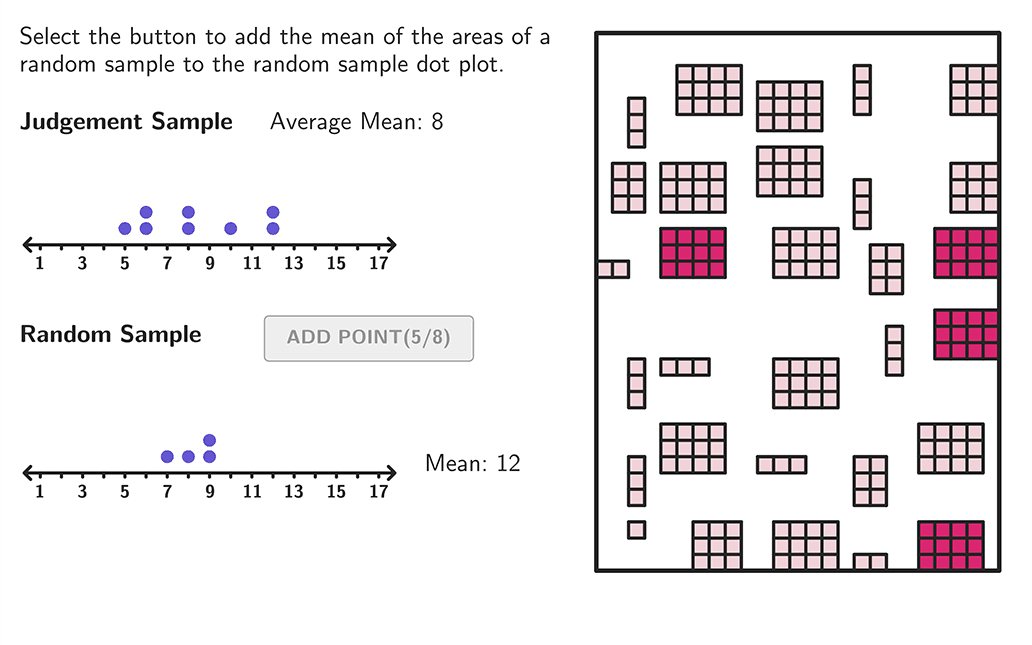
Inferences From Samples
Make inferences about a population based on a sample and compare variation in multiple samples.
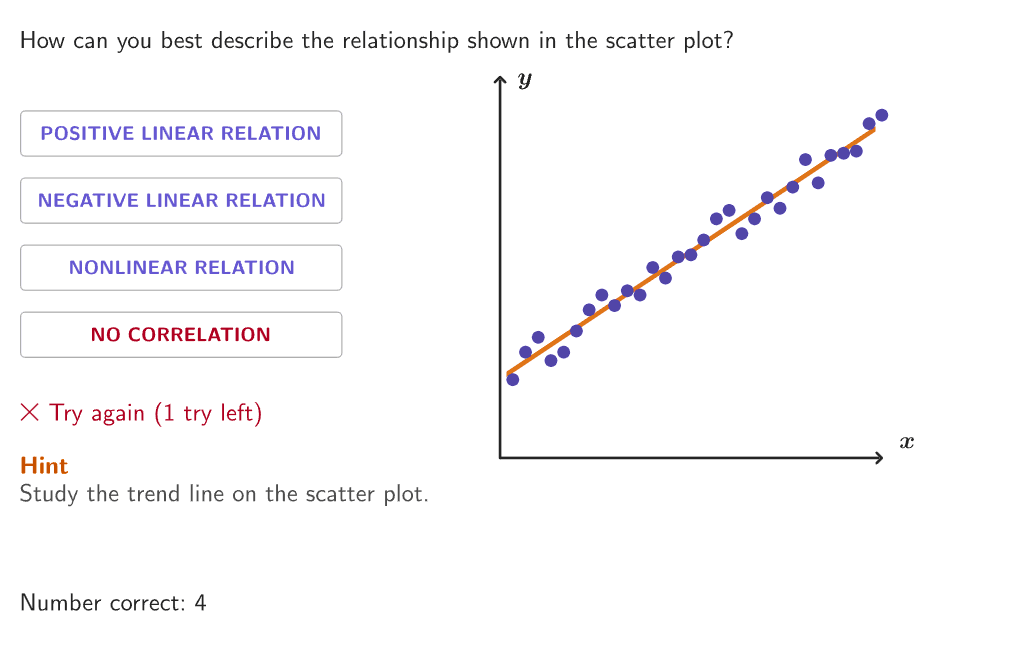
Linear and Nonlinear Relationships in Data Sets
Identify linear and nonlinear relationships in data sets.
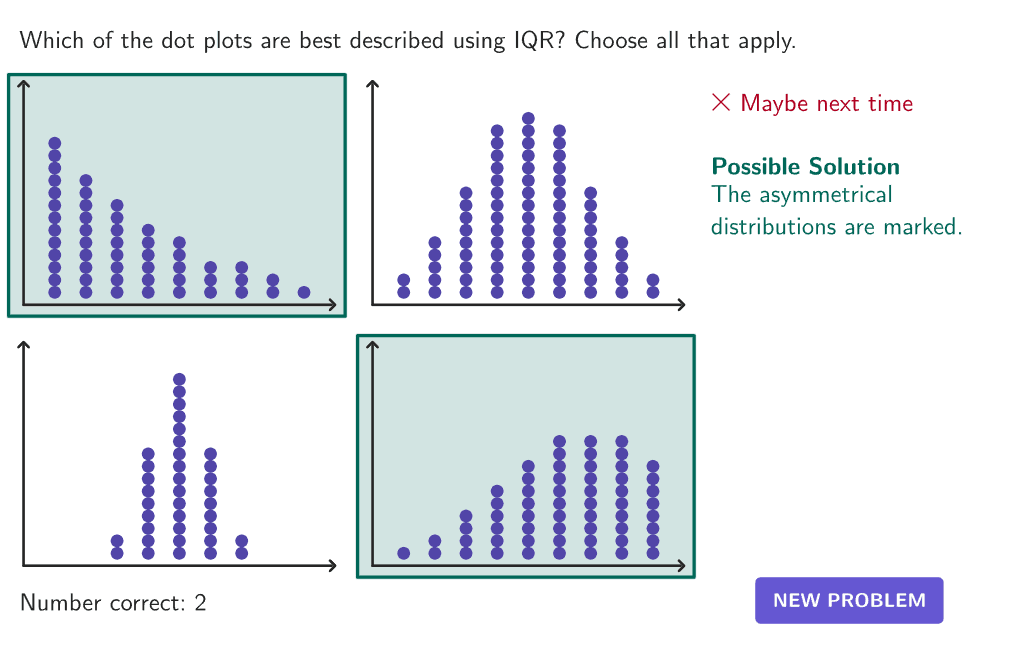
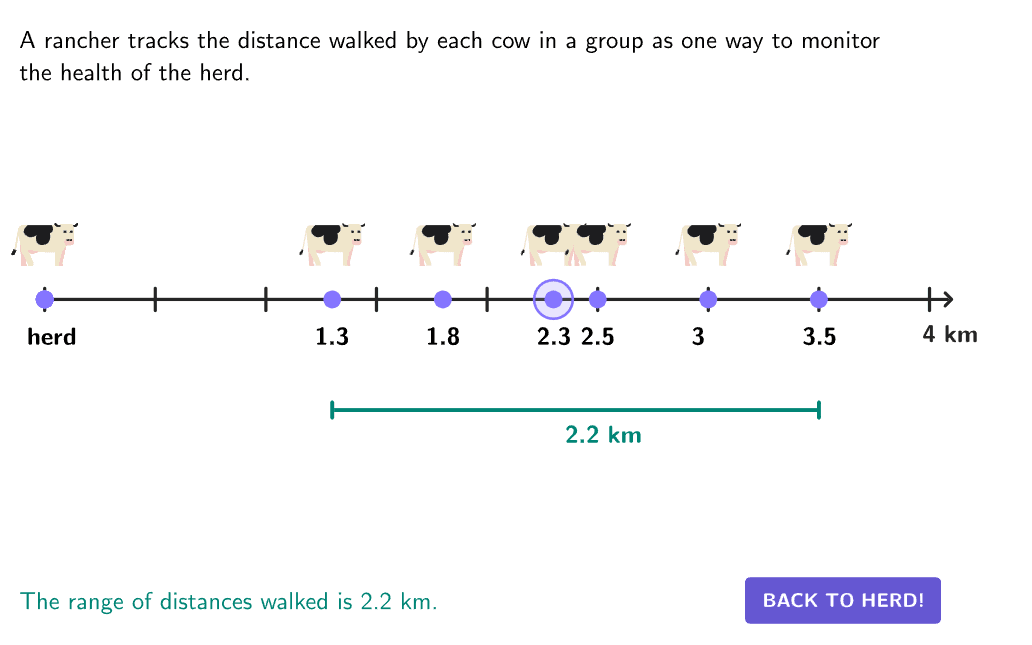
Measures of Variability
Select the appropriate measure of variability; choose a measure of variability based on the presence of outliers, clusters, and the shape of the data distribution.
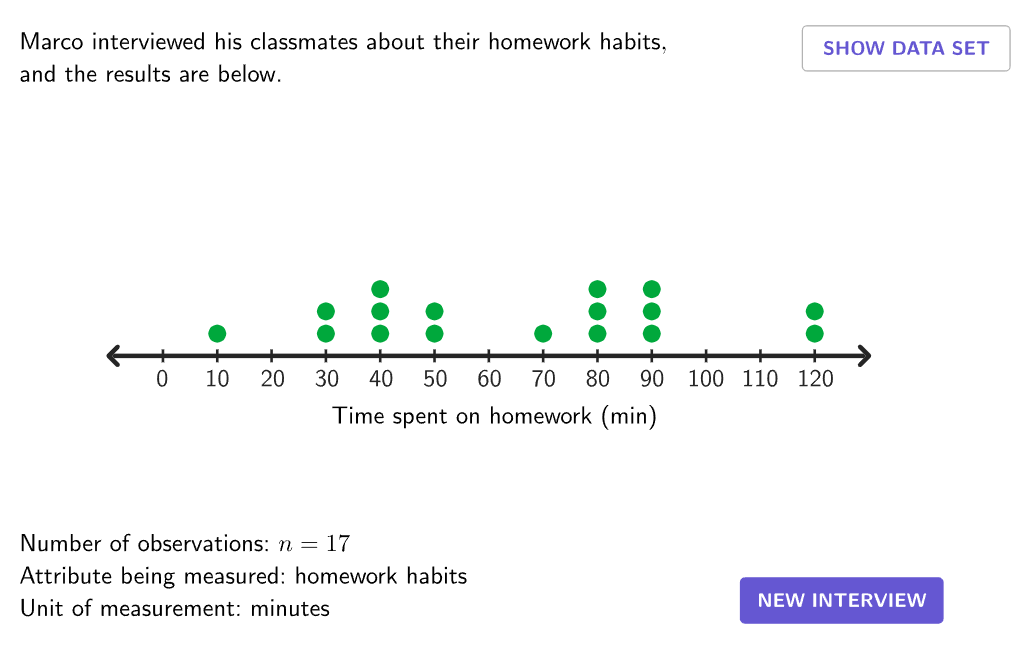
Observation, Measurement, and Sampling
Describe a data set by its number of observations, what is being measured, and the units of measurement.
Population vs. Sample
Distinguish between a population and a sample and draw conclusions about the sample (random or biased).
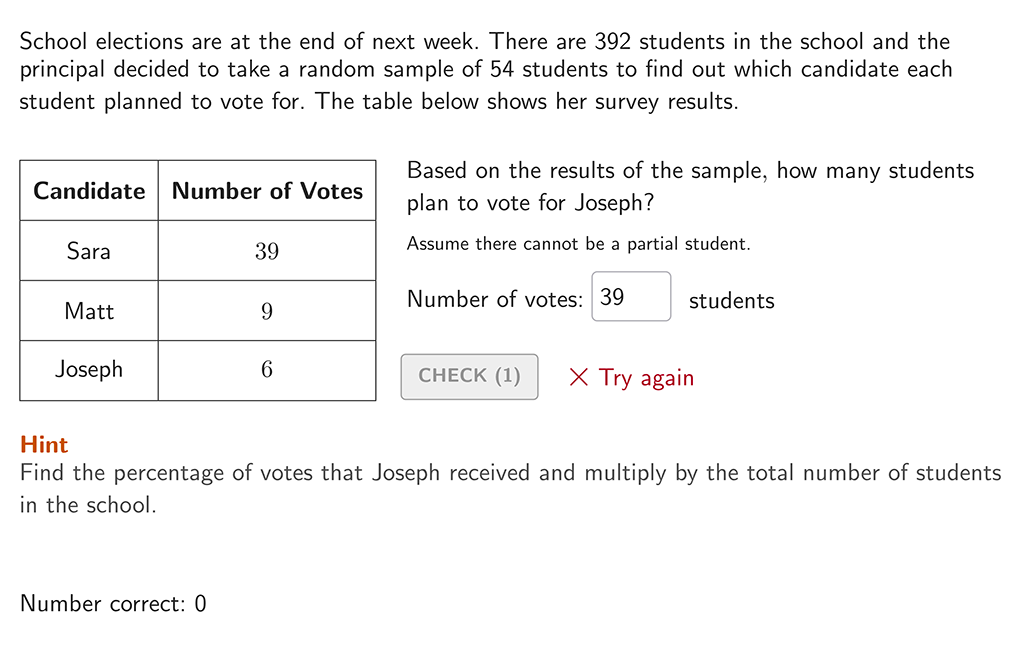
Predictions From Samples
Make predictions based on results from surveys and samples.
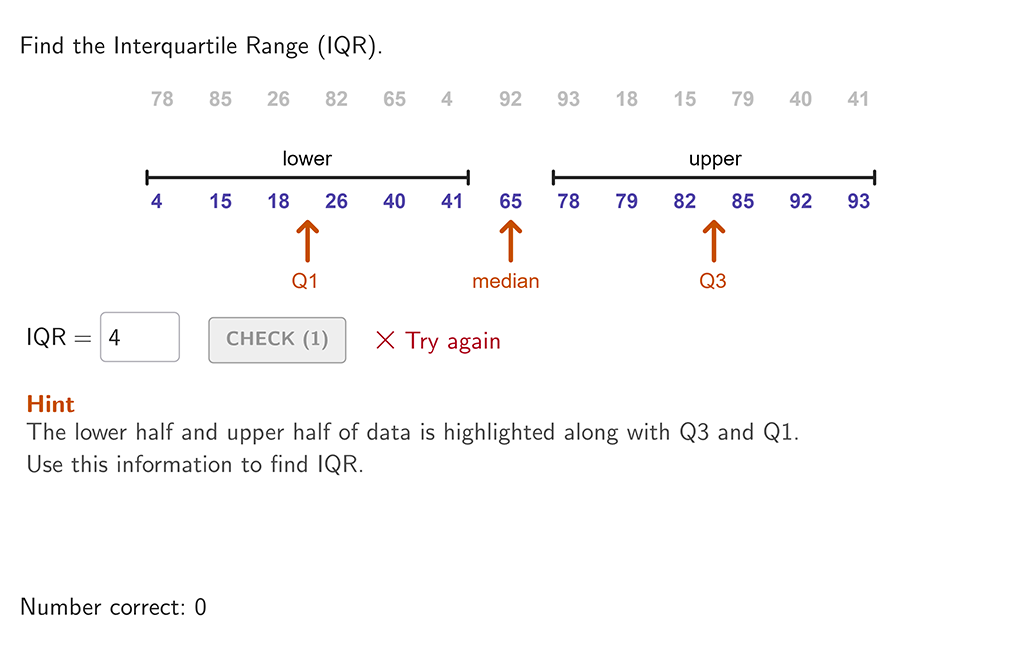
Quartiles and Interquartile Range of Data
Determine the quartiles or interquartile range for a set of data.
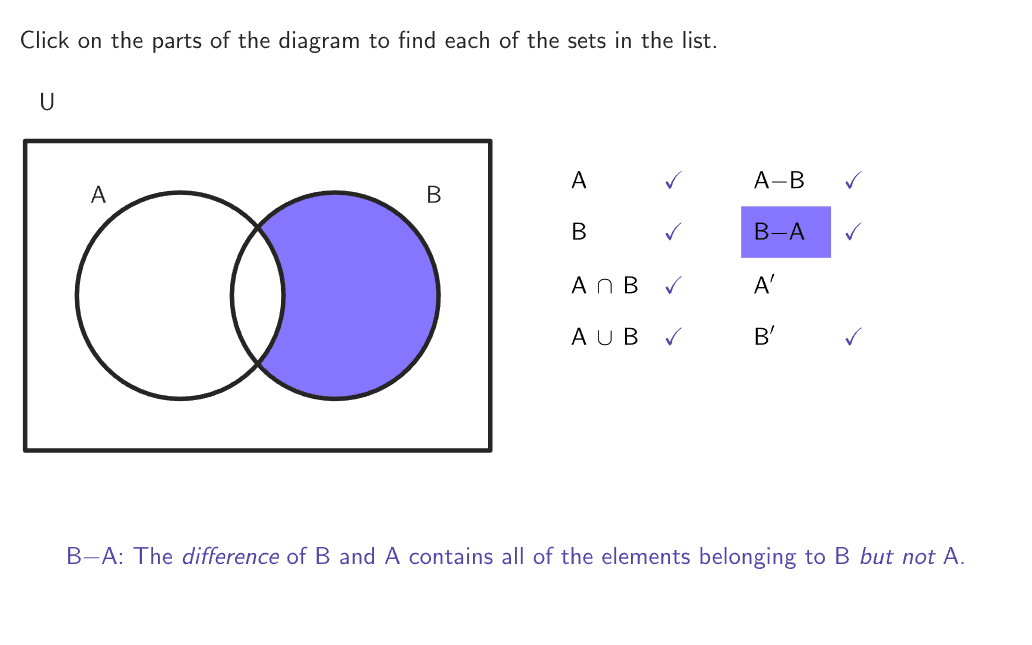
Set Theory
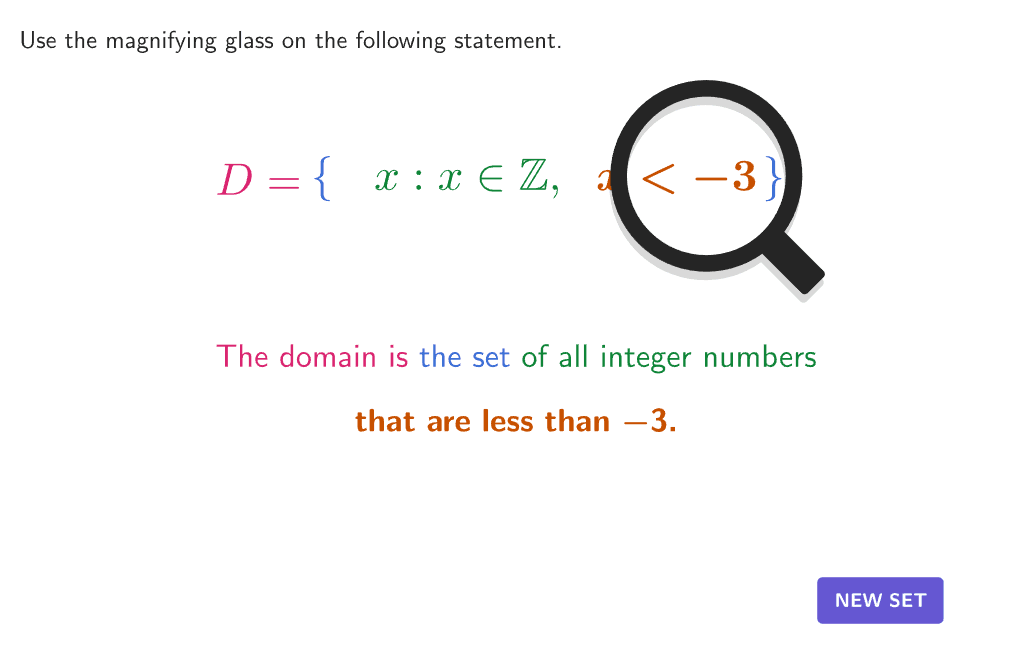
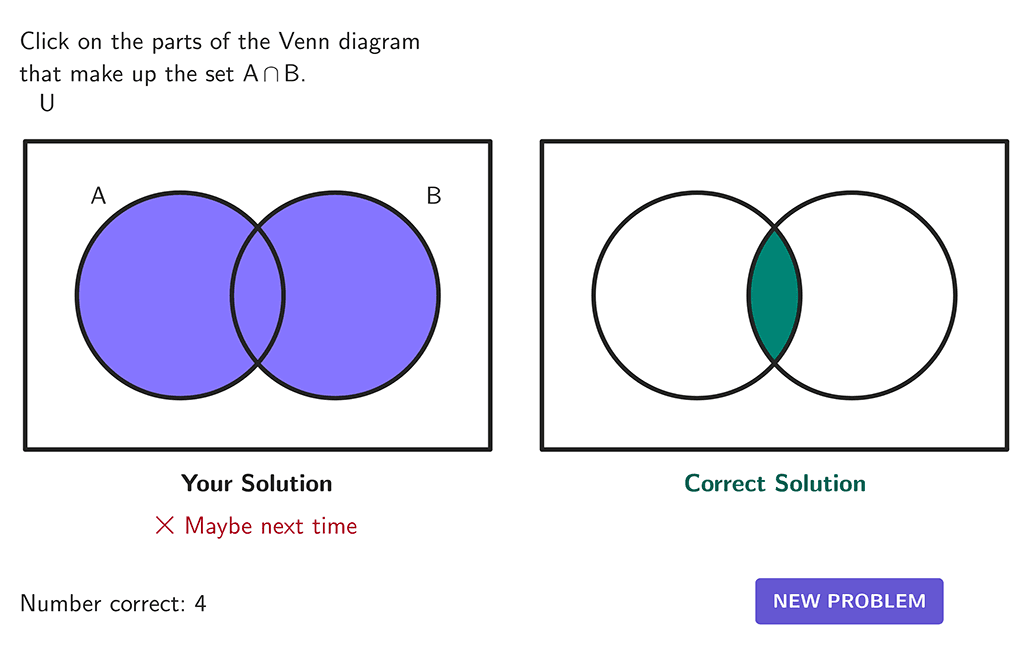
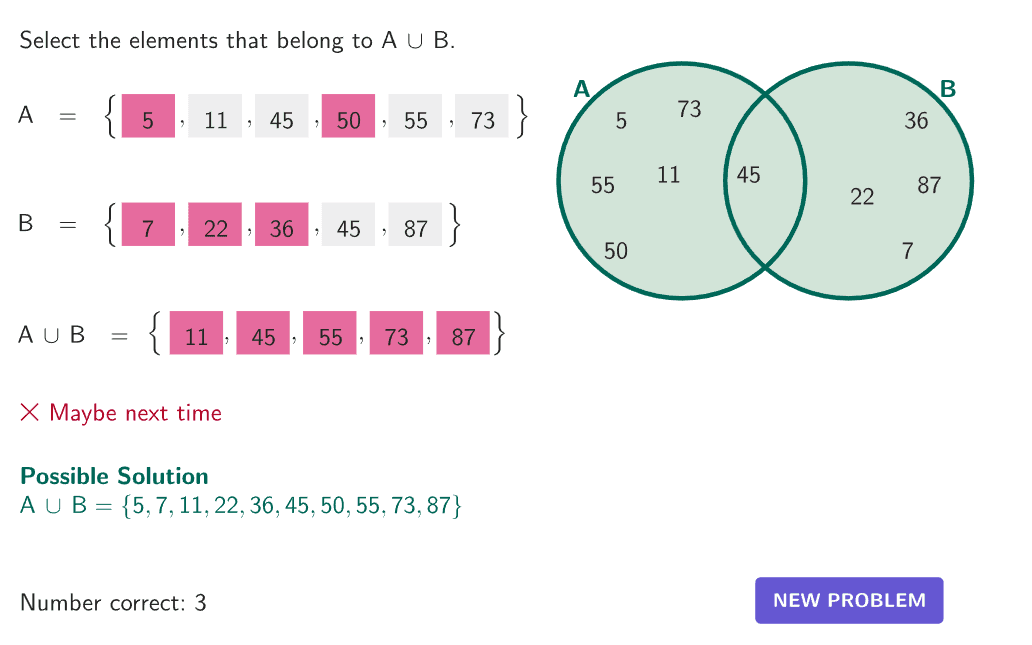
Use set notation to describe domains, ranges, intersection, and union of sets. Identify cardinality of sets, equivalent sets, disjoint sets, complement, or subsets.
Two-way tables
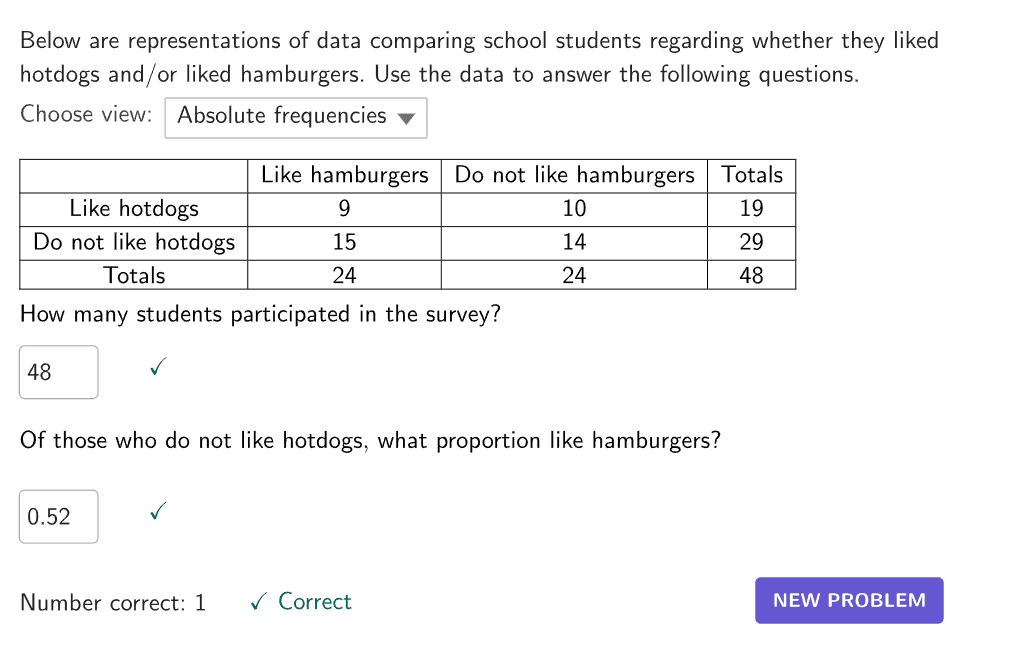
Construct and interpret a two-way table to display two categories of data from the same source.
High School
GRADES 9-12
Correlation Coefficient, Correlation and Causation- Differences, Design and Examples
Use models to make predictions and interpret the correlation coefficient of the model; distinguish between correlation and causation.
Lines of Best Fit
Derive a linear equation that models a set of data (line of best fit) using calculators. Use the model to make predictions.
Thèmes en Lien
Ressources de la Communauté
Explorez une vaste collection de plus d'un million d'activités, d'exercices et de leçons de mathématiques et de sciences méticuleusement élaborés par notre communauté GeoGebra mondiale. Découvrez les possibilités illimitées qui y sont offertes.

Commencez à utiliser GeoGebra dès aujourd'hui
Créez un compte gratuit pour pouvoir sauvegarder vos progrès à tout moment et accéder à des milliers de ressources mathématiques que vous pourrez personnaliser et partager avec d'autres
