Bisector curve

This activity belongs to the GeoGebra book Voronoi Paintings. Let's stop considering the sites as point objects. Now they are isolated planar shapes. What will be the equivalent route to the Voronoi diagram, that is, where will be the points in the plane that are equidistant from the nearest sites to them? To begin with, let's consider only two circular sites. If both circles have the same radius, the perpendicular bisector of their centers again solves the question. But if they have different radii, the bisector will curve into a branch of a hyperbola, closest to the smaller circle (Figure 2).
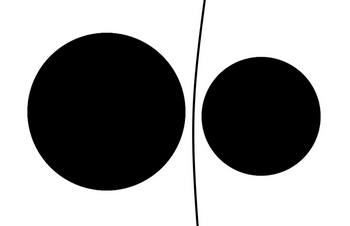
 Figure 2: Branch of a hyperbola equidistant from two circles

In general, the resulting line will depend on the shape of the boundary of each site. If we limit ourselves to straight or circular boundaries (we can consider the endpoints of a segment, straight or curved, as circles with zero radius), we obtain three possible types of equidistant routes:
  • Between circles (or points): perpendicular bisectors and hyperbolas.
  • Between lines: angle bisectors.     
  • Between lines and circles (or points): parabolas.
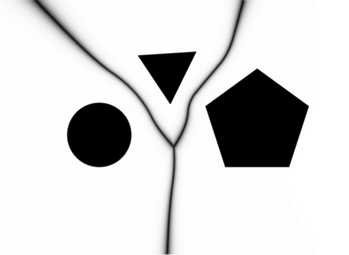
Regardless of the case, we will call the resulting route a bisecting curve, which will therefore be composed of straight segments (perpendicular bisectors and angle bisectors) and parabolic and hyperbolic arcs. This bisecting curve, applied to a collection of sites, creates a diagram that we will continue to call, without fear of confusion, a Voronoi diagram (Figure 3), since we can interpret it as a generalization of the Voronoi diagram generated by point sites (see [1] for recent research work in this context).

 Figure 3: Voronoi diagram of three planar shapes

Note that, sometimes, not all points on the boundary of a shape are involved in generating the bisecting curves that make up the Voronoi diagram. For example, the exact position of the rightmost vertex in the pentagon in Figure 3 does not affect the diagram. We will call the sensitive edge of a shape the part of the boundary that is actually necessary to generate the diagram. We have opted for the term sensitive because this characteristic depends not only on the shape itself but also on the distribution of the other shapes surrounding it. Authors of the activity: Rafael Losada & Tomás Recio.