Transform sine horizontally, stretch and translate together
Interact with the applet to observe how the shape of the graph changes when parameters b and c are changed.
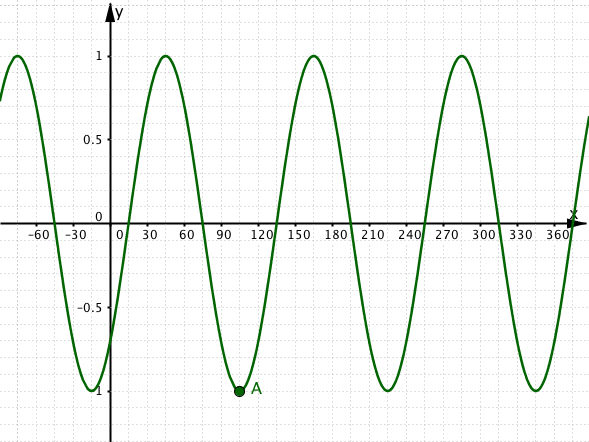
Observe the coordinates of point A.
What generalisations can you make about the x coordinate of the point A, relative to the value of b and of c?
Graph 1: y= sin(b(x-c)°)
The values b and c.
Notice that as b increases, the number of complete waves between 0 and 360 changes.
The horizontal distance between the crest of one wave and the crest of the next wave is called the period.
Notice that the value c is the horizontal translation or the shift. When we see the curve moves 45 units to the right.
1(a)
What is the numerical relationship between the value b in the equation and the period of the curve?
1(b)
What happens to the curve when it is transformed to ?
1(c)
The point lies on the curve . What is the image of this point on the curve ?
Graph 2.

2(a)
Which one of the following equations is a correct equation for Graph 2?
2 (b)
What is the x coordinate of the point A?
Graph 3.

3(a)
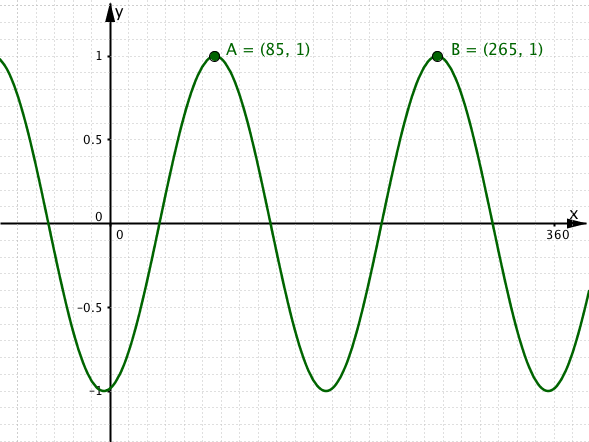
The curve in graph 3 has equation . The first local maximum point has x coordinate 85; the second local maximum point has x coordinate 265. What is the value of b?
3(b)
The curve in graph 3 has equation . The first local maximum point has x coordinate 85; the second local maximum point has x coordinate 265. What is the value of c?