Esquema
GeoGebra Tools for Visualizing Integration
GeoGebra Tools for Visualizing Integration (with Mapping Diagrams)
ICTCM 2019
30 Minute Session
Martin Flashman
Professor Emeritus of Mathematics
Humboldt State University
Visiting Scholar, University of Arizona
flashman@humboldt.edu
Link to this GeoGebra book:
https://www.geogebra.org/m/xmsj6rqg
General Links: https://flashman.neocities.org/Presentations/ICTCM2019.LINKS.html
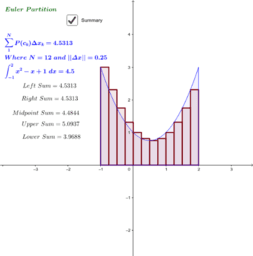
Abstract: GeoGebra provides many tools for understanding the definite integral.
Mapping diagrams provide a dynamic visual alternative to graphs for understanding functions. These diagrams make sense of the differential, differential equations, and integration by visualizing approximations and model based data.
In this session participants will learn how to use and modify activities created with GeoGebra to present mapping diagrams and related tables and graphs. These tools, available for use directly with GeoGebra or through online web-based files, make sense of calculus concepts and computations related to the differential, solving differential equations, and integration.
Prior experience with GeoGebra or with creating web materials will be helpful but not needed.
Attendees will be given links to the presentation with a GeoGebra Book and included worksheets.