Google Classroom
GeoGebra
GeoGebra Classroom
Sign in
Search
Google Classroom
GeoGebra
GeoGebra Classroom
Outline
Statistic Collection and Visualization
Data Collection
Data Intepretation
Statistic Collection and Visualization
Author:
Randy Edwards
Topic:
Statistics
Introduction to Data Collection and Intepretation
Table of Contents
Data Collection
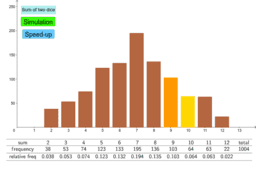
Rolling two dice
Coin Flip Simulation
Data Intepretation
Scatter Slider : Correlation & Line of Best Fit
Normal Distribution: mean, std.dev.
Next
Rolling two dice
New Resources
Rotation in Cartesian Plane
Tanzanian Ngoma - Model 2
Untitled
Tanzanian Ngoma - Model 1
Solving 2x2 and 3x3 Systems Using Cramer's Rule
Discover Resources
Intrinsic equations
Quadratic Function (Factorised Form)
Derivadas and Tangentes
Quiz on Concept of Power
Rolling two dice simultaneously - Sum of values - Exploration+Practice
Discover Topics
Sequences and Series
Geometric Transformations
Median Line
Coordinates
Line Segment