Interactively find and use CAS GeoGebra to compute local extrema of a nonlinear function of two variables
The purpose of this applet is to find and calculate the possible extremes of the nonlinear function f(x,y). The possibilities of such calculations are shown by the example of the sum of several nonlinear functions.
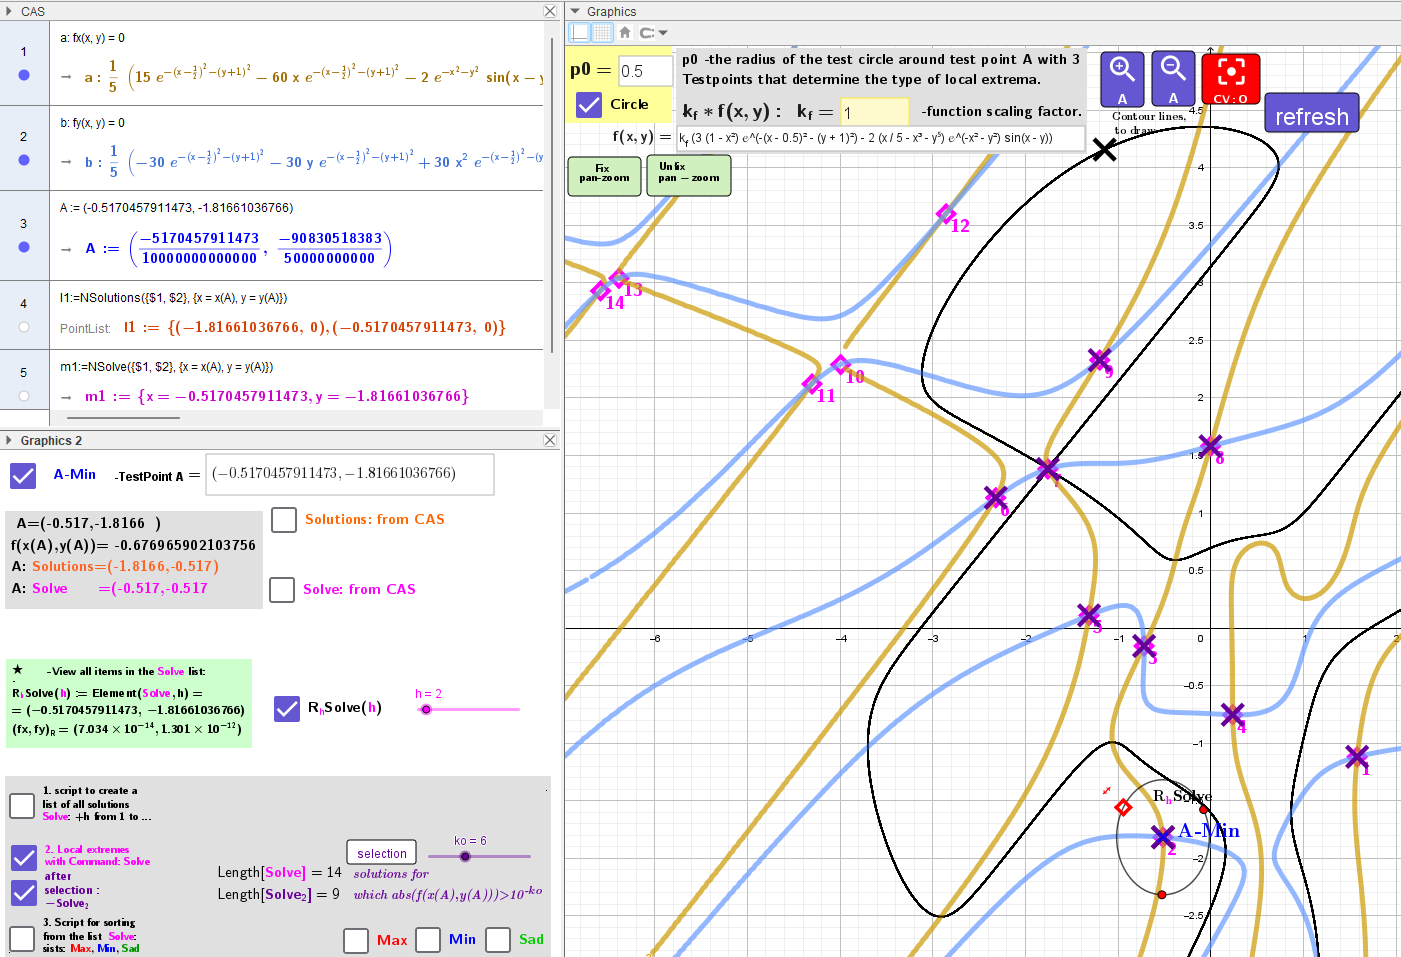
Method. The problem comes down to finding the first partial derivatives fx(x,y) and fy(x,y). Using equations with implicit functions fx(x,y)=0, fy(x,y)=0 in the CAS section of GeoGebra, the intersection points of these implicit functions are found numerically, which are possible extreme points.
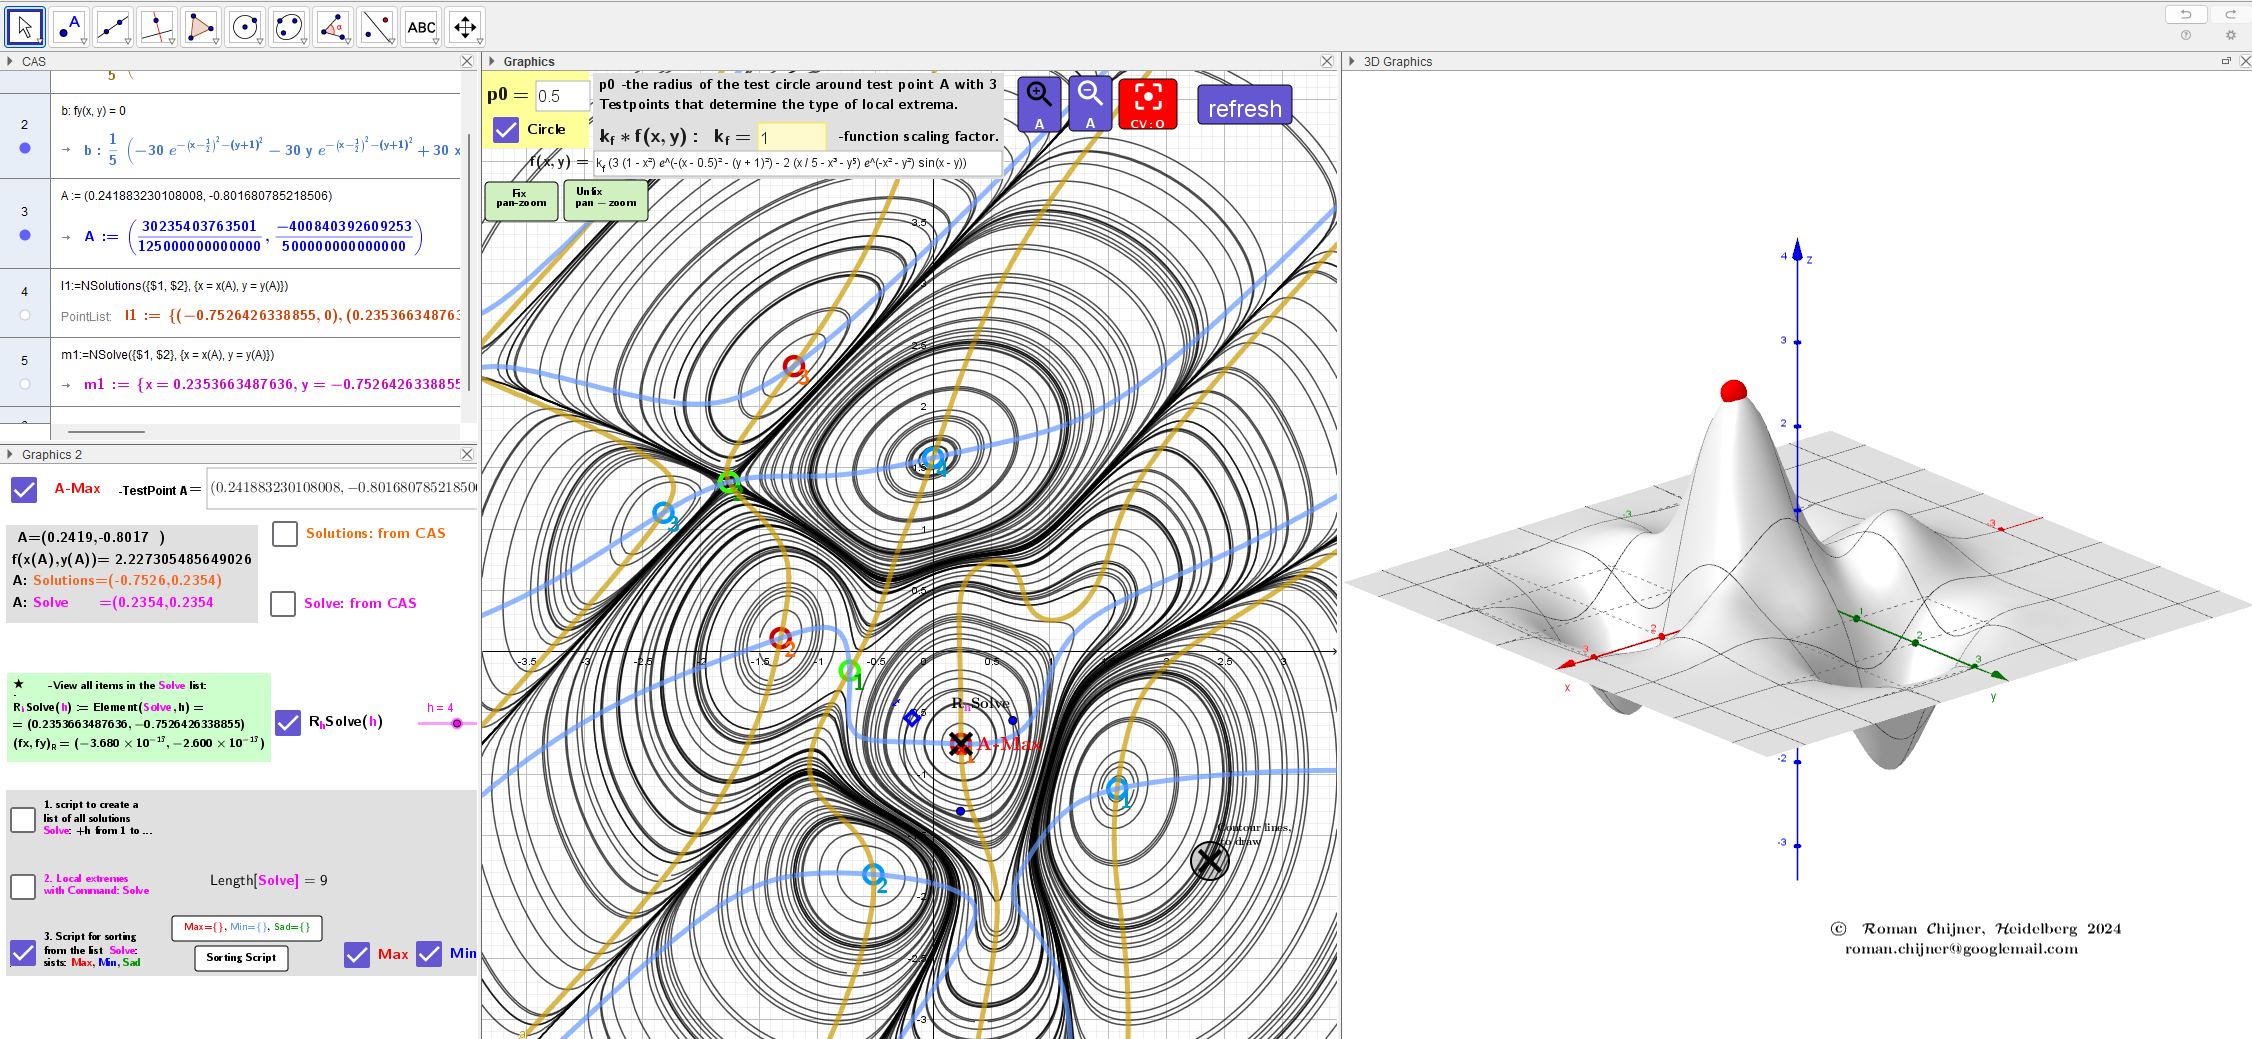
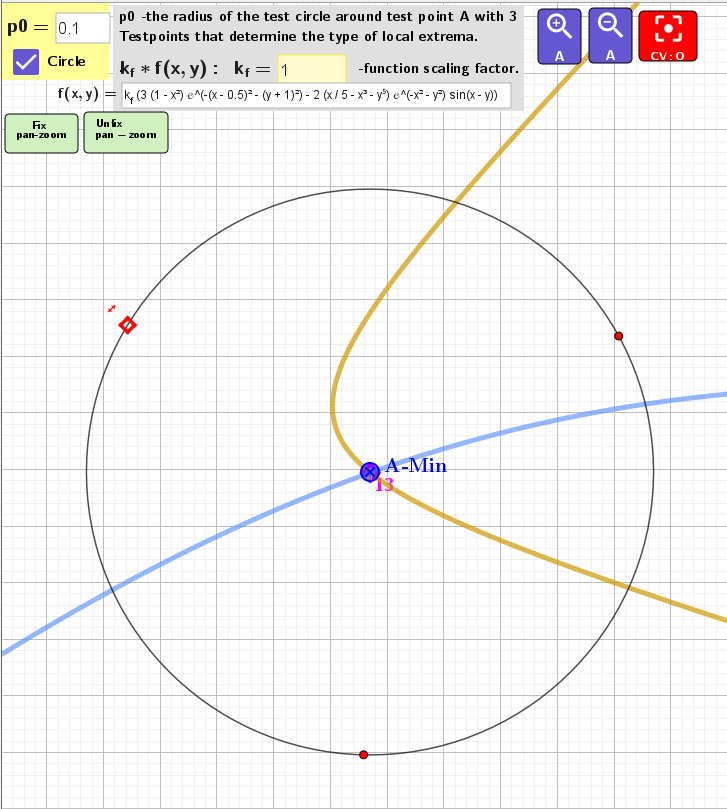
The applet provides an approximate method to determine the type of these points: maximum, minimum, saddle. There is a test circle with radius p0 and three moving points arranged at 120° to each other. If the test point is red, then it is the maximum point and the points on the circle are blue, i.e. the function is decreasing ↘ from the test point A. If it is blue, then it is the minimum, green is a saddle point. This is an approximate method. To be sure, you can rotate these points in a circle and see how their color changes. When refining the result, you can reduce the value of the radius p0.
What actions can you do with this applet?
In section 1. Collect all extreme points in one list. To do this: Set the test point A at each intersection of the curves fx(x,y)=0 and fy(x,y)=0 and press the "click script" button one after the other and with the help of the Solve command a list of all possible local extrema will be formed.
In Section 2. You can see these extrema and their ordinal numbers, their number -Length[Solve].
In Section 3. With the help of the available script these points can be sorted into lists: Max, Min, Sad.
1. Visualizing a function of two variables using contour lines
2. Test point A to determine extremum type
3. Compare the work of commands: Solutions and Solve
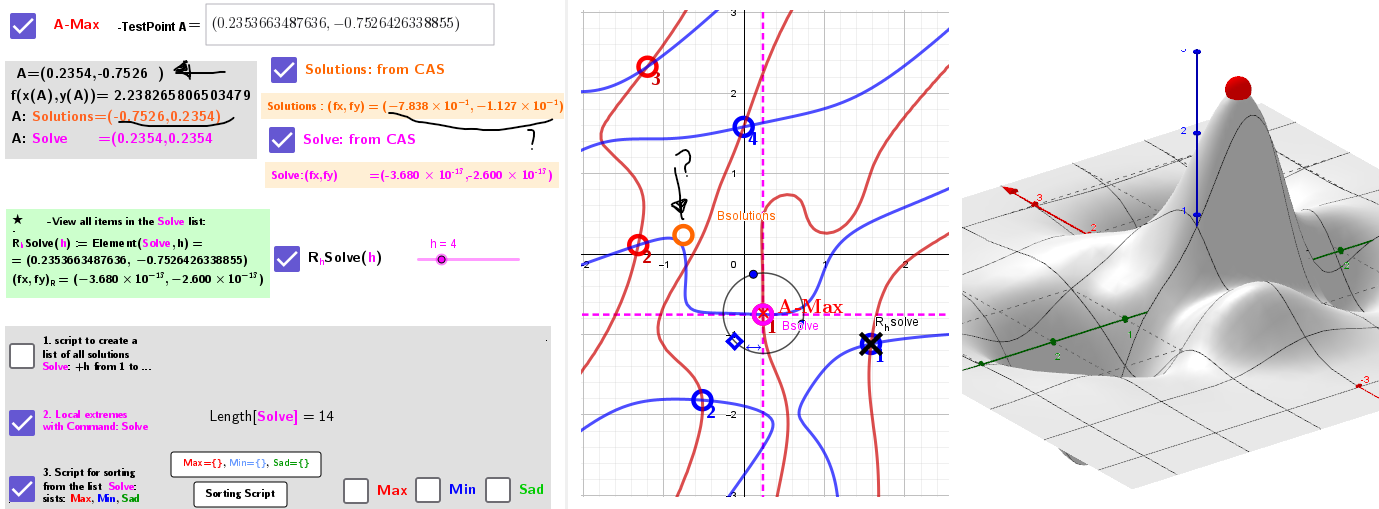
4. Selection of solutions