The Creation of Adam, Michelangelo
In this fresco painted on the ceiling of the Sistine Chapel, two large focal areas stand out to contrast the two main figures (Figure 9).
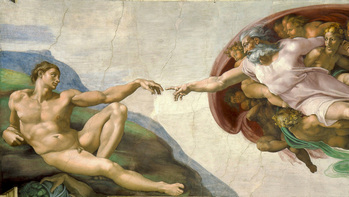
Figure 9: Two opposing focal areas
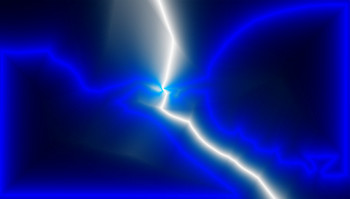
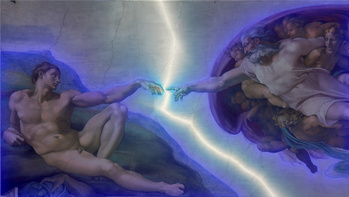
As the positive space is reduced to two areas, only one bisecting curve will appear. Nevertheless, the silhouettes of both areas, considered as polygons, have too many sides. Because of this, in this painting as well as in the following ones, we will approximate the silhouettes with polygons with less detail. The effects of this simplification on the resulting Voronoi diagram are barely noticeable. Figure 10: Scanner result (left) and transparency (right)
To make the bisecting curve stand out as much as possible, we have adjusted our dynamic color scanner so that the curve appears in white. The polygons we have used will also be outlined in blue. Once the Voronoi diagram is created, we have overlaid it, as transparency, on the original painting (Figure 10). All these constructions can be viewed and downloaded from this GeoGebra book, created specifically for this article. Annex I of this book details the construction of the scanner we used to obtain this and other figures. Annex II includes a pre-configured application for use. For better and faster scanner results, it is recommended to download the construction.
Author of the activity and GeoGebra construction: Rafael Losada.