Google Classroom
GeoGebra
GeoGebra Classroom
登入
搜尋
Google Classroom
GeoGebra
GeoGebra Classroom
綱要
Estadística
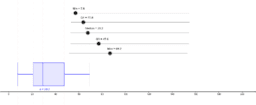
Boxplot Tool - Five Number Summary (0 to 200)
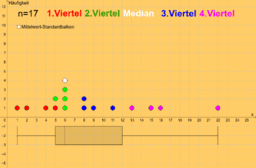
Boxplot: Datenaufteilung in Farbe
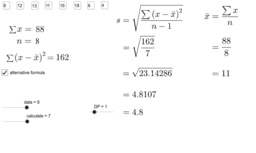
Standard Deviation Formulae
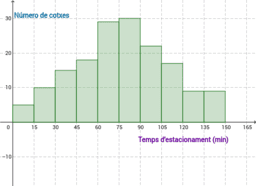
Histograma: Temps d'estacionament de cotxes en un aparcament
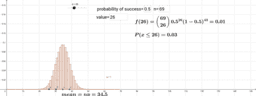
binomial distribution
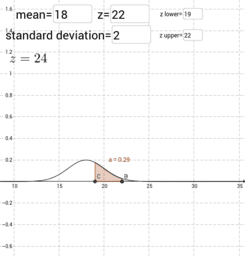
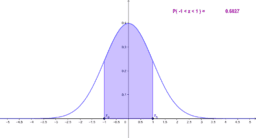
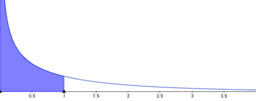
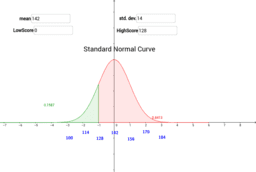
normal distribution
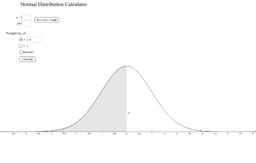
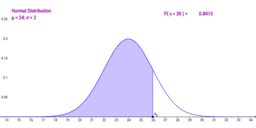
Normal Distrubution Calculator
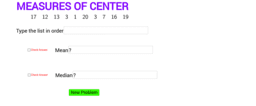
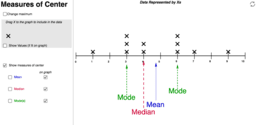
Measures of Center
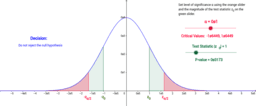
Hypothesis Test: Two-Tail, Normal Distribution
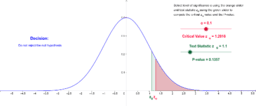
Hypothesis Test: Right Tail, Normal Distribution
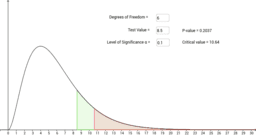
Chi Squared worksheet
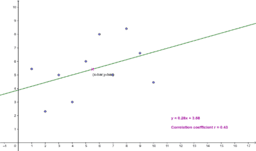
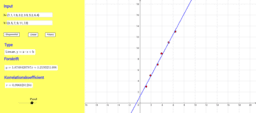
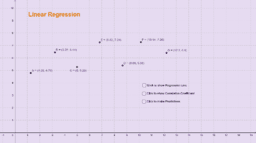
Linear Regression & Correlation Worksheet
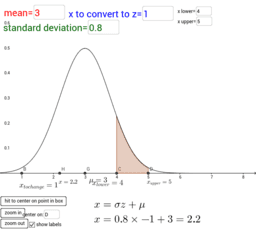
Standard Normal Distribution
Normal Distribution Worksheet (Left Tail)
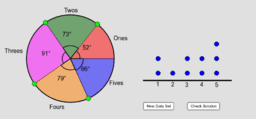
AQR Section 16: Matching a Pie Chart to a Dot Plot
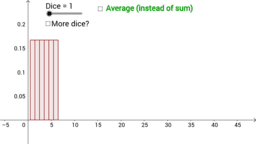
Probability distribution of dice
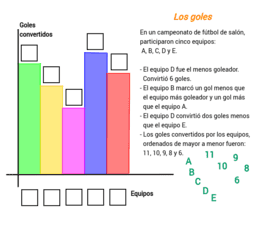
Estadística - Los goles
Chi2-test med 1 frihedsgrad
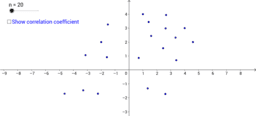
Correlation
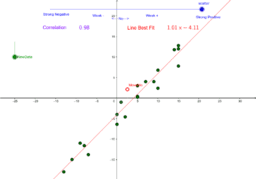
Scatter Slider : Correlation & Line of Best Fit
Lineær regression
Normal Distribution: mean, std.dev.
Linear Regression
normal curves and much more
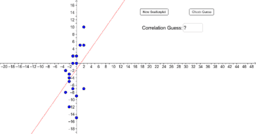
Guess the Correlation!
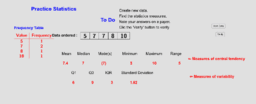
Practicing Statistical Calculation
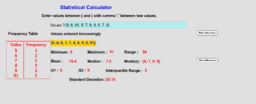
Statistical Calculator
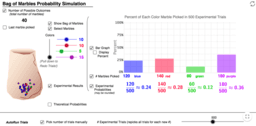
Bag of Marbles
Measures of Center - Dot Plot
Association/Correlation of Variables on a Scatterplot
Estadística
作者:
Cristina Masotta
Boxplot Tool - Five Number Summary (0 to 200)
Boxplot: Datenaufteilung in Farbe
Standard Deviation Formulae
Histograma: Temps d'estacionament de cotxes en un aparcament
binomial distribution
normal distribution
Normal Distrubution Calculator
Measures of Center
Hypothesis Test: Two-Tail, Normal Distribution
Hypothesis Test: Right Tail, Normal Distribution
Chi Squared worksheet
Linear Regression & Correlation Worksheet
Standard Normal Distribution
Normal Distribution Worksheet (Left Tail)
AQR Section 16: Matching a Pie Chart to a Dot Plot
Probability distribution of dice
Estadística - Los goles
Chi2-test med 1 frihedsgrad
Correlation
Scatter Slider : Correlation & Line of Best Fit
Lineær regression
Normal Distribution: mean, std.dev.
Linear Regression
normal curves and much more
Guess the Correlation!
Practicing Statistical Calculation
Statistical Calculator
Bag of Marbles
Measures of Center - Dot Plot
Association/Correlation of Variables on a Scatterplot
下一步
Boxplot Tool - Five Number Summary (0 to 200)
最新資源
Vectors: Addition and Subtraction - The Parallelogram Law
Measuring Cup
bewijs stelling van Pythagoras
Weighing Scales: Lessons and Practices
Weighing Scales (kg & g): Practice
探索資源
Συμμετρία
Rotations
Mod12NilaiMutlak_MuhammadRomli
Dice Rolling
Worksheet 2, Exercise 1
探索主題
統計特徵
最小公倍數與最大公因數
曲線描繪
不等式
等式