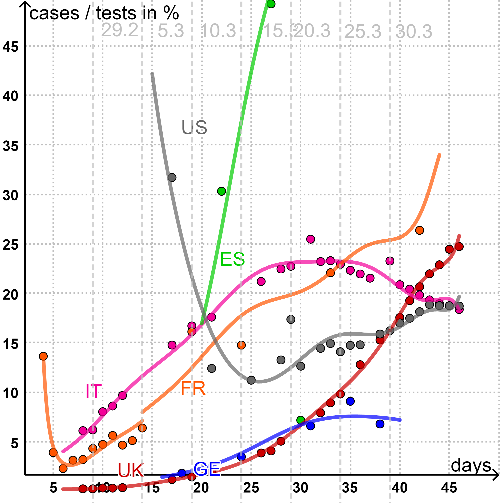
Corona case predictions
Positive cases divided by the total tests performed in %

Above you see the ratio between Covid cases and the total Covid tests performed over time in seven countries. For the daily clinical routine this ratio is not important. For predictions on the status of the corona infection in the entire country, however, it is crucial.
A ratio of 100% means, that every person tested gets a positive result on the Covid test. Countries which get closer to these values, either
1. decided intentionally to only test patients with acute/acuter symptoms, or
2. have to focus their testing performance on patients with acute/acuter symptoms, as it lacks more and more behind the need for testing in the country.
In this situation, this ratio is less and less valuable for predictions on the corona infection status in the entire country.
A ratio of close to 0% implies, that the country decided
1. to perform tests also on light symptoms(or at random) and has almost no infected citizens, and
2. the ratio gives a good estimate on the status of the corona infection in the entire country.
Total Corona cases
Corona cases (or positive tests) over time for six countries are marked as filled circles (logarithmic). You can move the crosses back and forth to see the evolution of total cases as numbers. You can zoom in and out!
The doubling rates are evaluated as a function of time on the right hand side. You can observe a weekly pattern in the doubling rates :-) Move the crosses!!
This indicates a delay in evaluation of test results from the weekend.
The filled checks indicate the day, where the countries installed a full closure of all educational institutions.
The open checks are the earliest cases of school closures in the respective countries.
The triangles indicate the day, where the states issued a total lockdown.
data taken from: https://www.worldometers.info/coronavirus/
Corona Testing capabilities
The testing capabilities are crucial for the reliability of the total cases in each country. See the following webpages:
https://ourworldindata.org/coronavirus
https://en.wikipedia.org/wiki/COVID-19_testing
This data is taken to evaluate the numbers in the picture on the top of the page.
Corona seen as a ball pit
Plain explanation of corona virus dynamics, simulated as a ball pit:
https://www.washingtonpost.com/graphics/2020/world/corona-simulator/