Transform sine vertically, stretch and translate together
Graph 1: Vertical Stretch, Vertical Translation
Interact with the applet to see how the values a and d transform the curve y=sin(x°).
Notice that when d=0, the graph rises from the x axis as much as it falls. The rise and fall from the horizontal center (sometimes known as the sinusoidal axis) is known as the amplitude.
Notice how the y value of the local maximum and of the local minimum can be calculated by the values of a and d.
1. Order of operations
Suppose you wish to transform to . Does it make mathematical sense to 1. stretch (multiply y values by 3) then to translate (add 5 to all new y values)? or to 2. translate (add 5 to all y values) then to stretch (multiply new y values by 3)? (Hint - take the point as an example - does the y value become or ?)
Graph 2.

2(a)
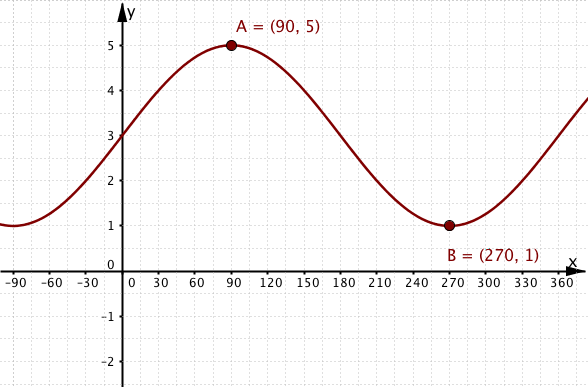
Graph 2 has equation where . Which one of the following is a correct equation for this function?
2(b)
What is the range of the function , shown in graph 2?
Graph 3.

3(a)
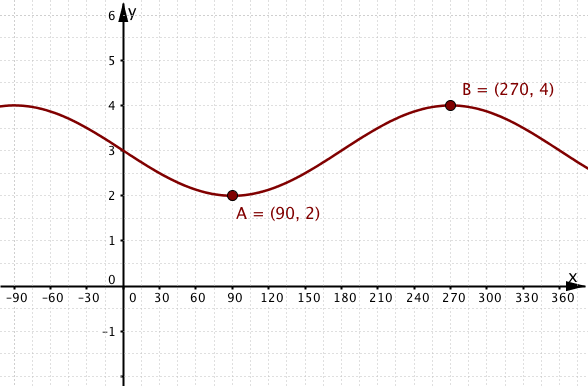
The graph of the function where is shown in graph 3. What is the equation of the function ?
3(b)
What is the range of the function ?
4
The function is defined . What is the range of ?