Investigating Graph of a Quadratic Function
Welcome to our class...
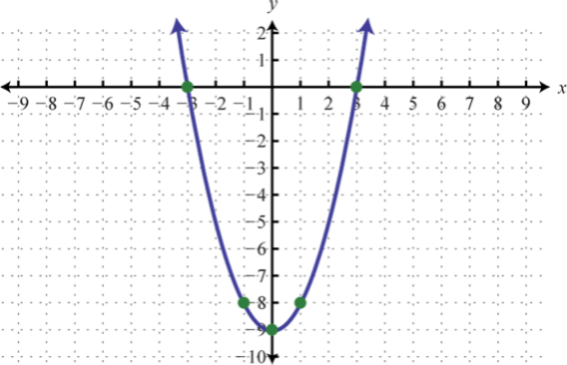
Describe the graph if a<0 and a>0.
What will be formed if a=0?
What happens to the graph with respect to y=x^2 as k increases and decreases
Read and understand the given website.
Watch the given video.