IM3.7.6 Basics
Mean and Standard Deviation

Distribution of Battery Life
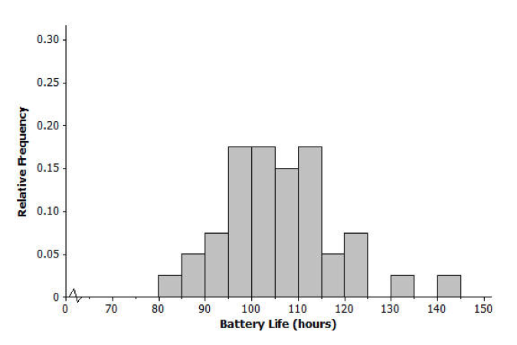
Have you ever noticed how sometimes batteries seem to last a long time, and other times the batteries seem to last only a short time?The histogram above shows the distribution of battery life (hours) for a sample of batteries of the same brand. When studying a distribution, it is important to think about the shape, center, and spread of the data. 1. Would you describe the distribution of battery life as approximately symmetric or as skewed? Explain your answer. 2. Is the mean of the battery life distribution closer to 95, 105, or 115 hours? Explain your answer. 3. Consider 5, 10, or 25 hours as an estimate of the standard deviation for the battery life distribution. a. Consider 5 hours as an estimate of the standard deviation. Is it a reasonable description of a typical distance from the mean? Explain your answer. b. Consider 10 hours as an estimate of the standard deviation. Is it a reasonable description of a typical distance from the mean? Explain your answer. c. Consider 25 hours as an estimate of the standard deviation. Is it a reasonable description of a typical distance from the mean? Explain your answer.