Graphics
Modify the values of the coefficients (a, b and c) of the quadratic function, and observe the changes in the other representations (rule, table and graph).
Coefficient a
a) What happens to the graph when a = 0? b) What happens to the graph when a > 0 (positive)? c) What happens to the graph when a < 0 (negative)? d) What does the coefficient "a" tell us about the graph of the parabola?
Coefficient c
a) What happens to the graph when c = 0? b) What happens to the graph when c > 0 (positive)? c) What happens to the graph when c < 0 (negative)? d) What does the coefficient "c" tell us about the graph of the parabola?
Coefficient b
Consider a>0 a) What happens to the graph when b = 0? b) What happens to the graph when b> 0 (positive)? c) What happens to the graph when b < 0 (negative)? Consider a<0 d) What happens to the graph when b = 0? e) What happens to the graph when b> 0 (positive)? f) What happens to the graph when b < 0 (negative)? g) Write your conclusion.
X-axis
Does every graph of a quadratic function always intersect the X-axis at two points (roots)? Explain.
Y - axis
Does every graph of a quadratic function always intersect the Y-axis at one point? Explain.
Look the geogebra below. V is the vertex of the function.
What is the vertex of a parabola? Look the formula to calculate the (xv, yv)
Relate b to the vertex of the parabola.
Stop here and Practice it!
To help you do the following exercises,read the link below.
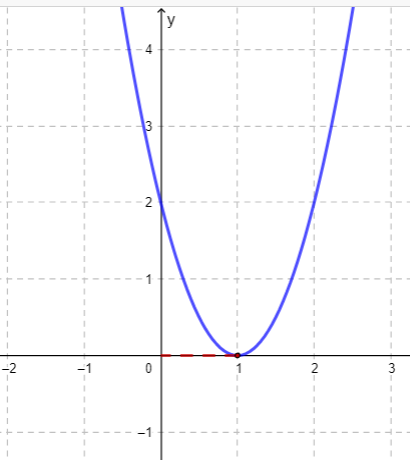
Look the Graphic below.
Find the values for the coefficients a, b, and c of the quadratic function below so that its graph looks like the following figure. Then write its function and verify in the Geogebra.
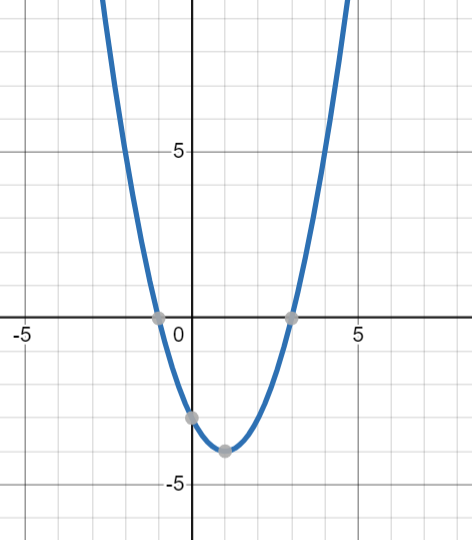
Look the Graphic below.
Find the values for the coefficients a, b, and c of the quadratic function below so that its graph looks like the following figure. Then write its function and verify in the Geogebra.
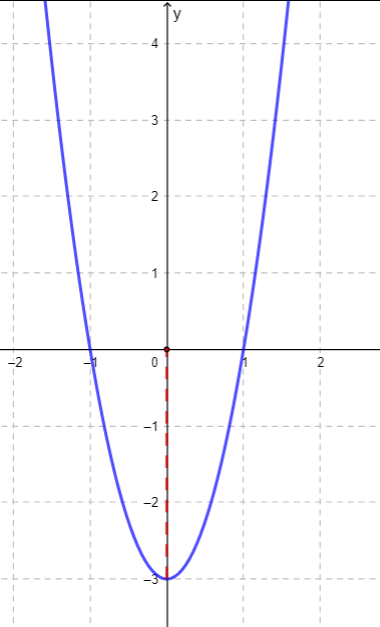
Look the Graphic below.