The User Interface
The User Interface of the GeoGebra 3D Grapher consists of the  Algebra View and the
  3D Graphics View of GeoGebra. Both Views are dynamically connected, which means that modifications in any View are immediately displayed in the other View as well.
Examples:
3D Graphics View of GeoGebra. Both Views are dynamically connected, which means that modifications in any View are immediately displayed in the other View as well.
Examples:
Algebra View and the 3D Graphics View of GeoGebra. Both Views are dynamically connected, which means that modifications in any View are immediately displayed in the other View as well.
Examples:
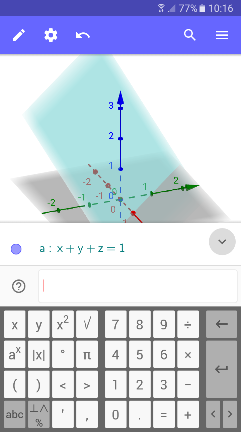
- Enter the equation of a plane (e.g.
x+y+z=1) or a function (e.g.f(x,y)=sin(x)*sin(y))in the Algebra View and watch how it is graphed in the 3D Graphics View.
- Drag a point in the 3D Graphics View and watch how its coordinates change in the Algebra View.
The Header Bar
 Toolbar
Use the button in order to open the Toolbar providing access to the GeoGebra Tools. Select any Tool and create new objects in the 3D Graphics View.
Note: To go back to the blue Header bar, use
Toolbar
Use the button in order to open the Toolbar providing access to the GeoGebra Tools. Select any Tool and create new objects in the 3D Graphics View.
Note: To go back to the blue Header bar, use 
 Object Properties
Depending on the selected object, the Object Properties for this object is opened allowing you to change its color, style or size. If no object is selected, the Properties for the 3D Graphics View is opened, allowing you to hide or show the axes and a grid, as well as change the view on the objects.
Object Properties
Depending on the selected object, the Object Properties for this object is opened allowing you to change its color, style or size. If no object is selected, the Properties for the 3D Graphics View is opened, allowing you to hide or show the axes and a grid, as well as change the view on the objects.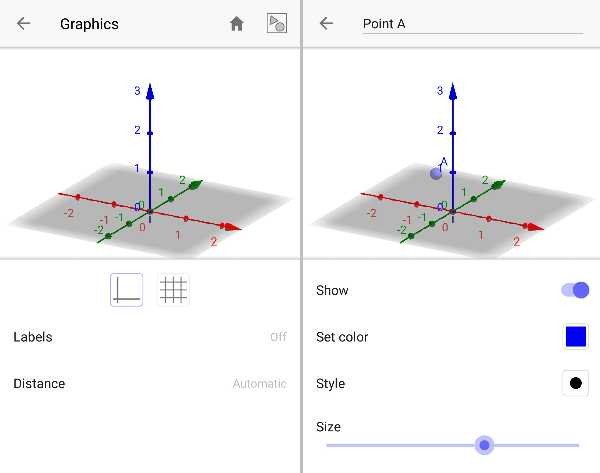
 Undo
Undo your activities step by step.
Note: The Undo button automatically also appears in the Toolbar after one or more objects have been created.
Undo
Undo your activities step by step.
Note: The Undo button automatically also appears in the Toolbar after one or more objects have been created.
 Redo
Redo your activities step by step.
Note: The Redo button automatically appears in the Header- und Toolbar after undo one or more steps.
Redo
Redo your activities step by step.
Note: The Redo button automatically appears in the Header- und Toolbar after undo one or more steps.  Search
Open the Search feature and browse the GeoGebra Materials Platform for awesome Materials.
Search
Open the Search feature and browse the GeoGebra Materials Platform for awesome Materials.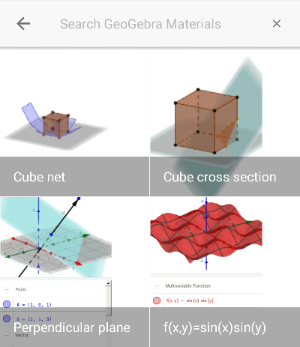
 Menu
Open the Menu of the GeoGebra 3D Grapher allowing you to create new files, open existing Materials, save your work and share it with others, as well as get help if needed.
Menu
Open the Menu of the GeoGebra 3D Grapher allowing you to create new files, open existing Materials, save your work and share it with others, as well as get help if needed.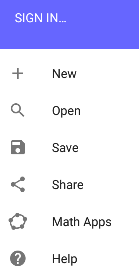 Algebra View, you may hide it by tapping on Algebra View again at any time using