Spreadsheet tools for data analysis
The Spreadsheet View toolbar
The Spreadsheet Tools are organized in GeoGebra's Spreadsheet View Toolbar:
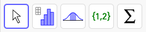 It contains a variety of Spreadsheet Tools which are organized in Toolboxes and can be operated with your pointing device.
It contains a variety of Spreadsheet Tools which are organized in Toolboxes and can be operated with your pointing device.Task
Do  One Variable Analysis and
  Two Variable Regression Analysis with the Spreadsheet Tools for Data Analysis.
One Variable Analysis and Two Variable Regression Analysis with the Spreadsheet Tools for Data Analysis. Instructions
One Variable Analysis
Highlight all cells of column A that contain data and then activate the tool One Variable Analysis.
In the appearing dialog you can display the following information:
 Graphs: You can display one or two different graphs (e.g. histogram, boxplot), which you can select from a list.
 Statistics: The statistical Analysis of the data is displayed in a table.
 Data: The analyzed data is displayed in a table.
- By default, only one of the graph panels is displayed. You can display the other panels by using the Style Bar of the dialog.
 Settings: You can modify the settings of the selected graph.
 Export: You can copy a graph to the
  Graphics View or export it as an image file.
Try it yourself...
Instructions (continued)
 Two Variable Regression Analysis
Highlight two columns with paired number data in the spreadsheet. Then, activate the tool Two Variable Regression Analysis.
In the appearing dialog you can display the following information:
Two Variable Regression Analysis
Highlight two columns with paired number data in the spreadsheet. Then, activate the tool Two Variable Regression Analysis.
In the appearing dialog you can display the following information:
- Graphs: You can display one or two different graphs (e.g. scatterplot, residual plot), which you can select from a list. Below the graph you can choose between different regression models for the data. When a model is selected, its graph is drawn on the plot and the equation is shown underneath.
- Statistics: The statistical Analysis of the data is displayed in a table.
- Data: The analyzed data is displayed in a table.
- You can decide which data column should determine the x-coordinates and which should be used for the y-coordinates of the points.
- By default, only one of the graph panels is displayed. You can display the other panels by using the Style Bar of the dialog.
- Settings: You can modify the settings of the selected graph.
- Export: You can copy a graph to the Graphics View or export it as an image file.