Google Classroom
GeoGebra
Classe GeoGebra
Se connecter
Chercher
Google Classroom
GeoGebra
Classe GeoGebra
Contour
statistics
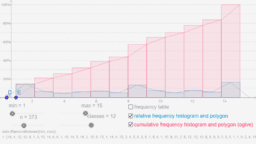
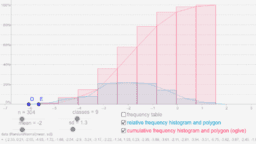
histograms
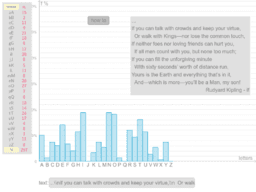
distribution of letters
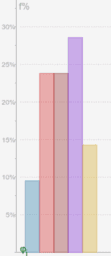
pie chart
Practicing Statistical Calculation-1
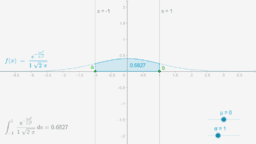
the bell curve
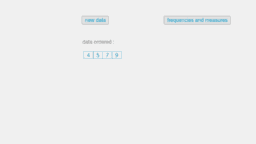
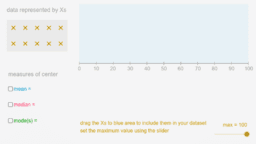
measures of center
pi digits
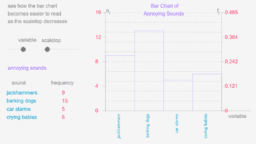
frequency scale
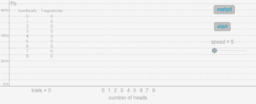
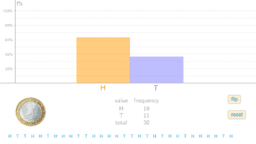
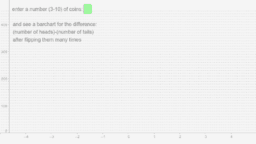
coin flipping-1
flipping a coin
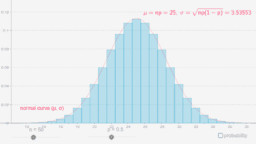
binomial and normal
random data-1
random data-2
coin tossing simulation
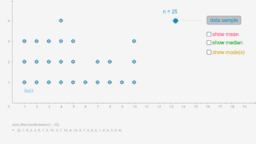
dotplot
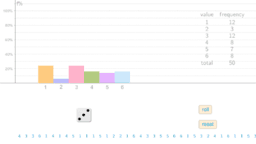
rolling a dice
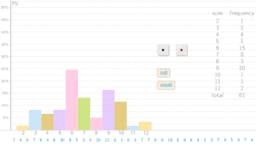
rolling two dice
statistics
Auteur :
sonom
Thème :
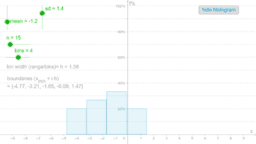
Histogramme
,
Moyennes
,
Valeur Médiane
,
Mode
,
Statistiques
histograms
distribution of letters
pie chart
Practicing Statistical Calculation-1
the bell curve
measures of center
pi digits
frequency scale
coin flipping-1
flipping a coin
binomial and normal
random data-1
random data-2
coin tossing simulation
dotplot
rolling a dice
rolling two dice
Suivant
histograms
Nouvelles ressources
רישום חופשי
Quiz: Identifying Opposite, Adjacent & Hypotenuse
Parts of a Circle
Parametric surfaces: Sphere
גיליון אלקטרוני להעלאת נתוני בעיה ויצירת גרף בהתאם
Découvrir des ressources
Introduction to Functions
Bowtie
Definitie dr perpendiculara pe plan
圖形I
Perpendicular Bisectors of Triangles
Découvrir des Thèmes
Hyberbole
Calcul
Valeur Attendue
Losange
Trapézoïde