


Comparing Box-and-Whisker and Dot Plots
Comparing Box-and-Whisker and Dot Plots
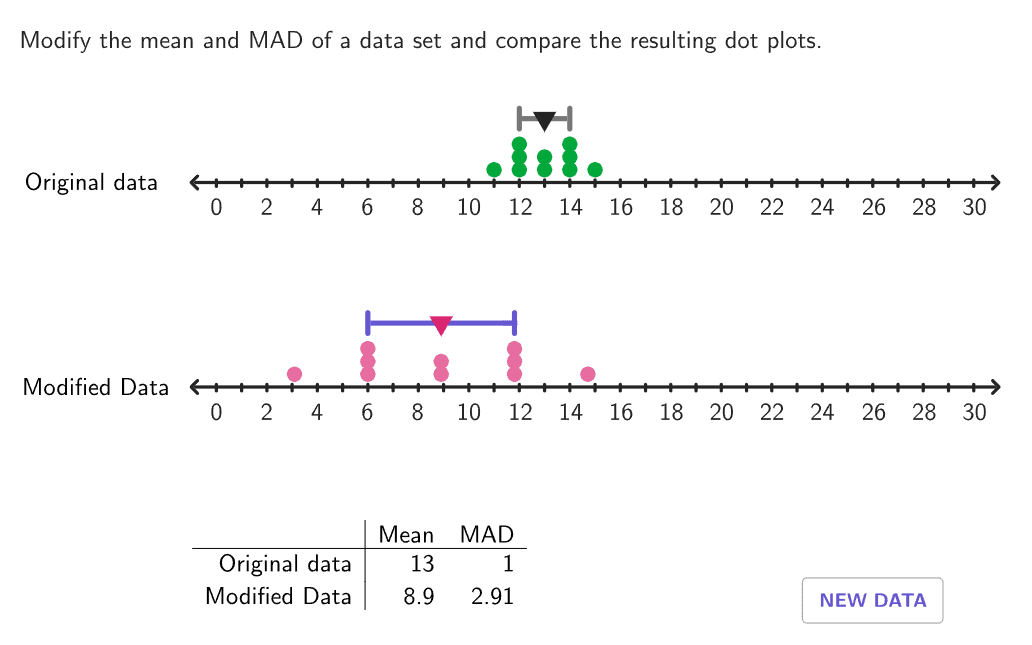
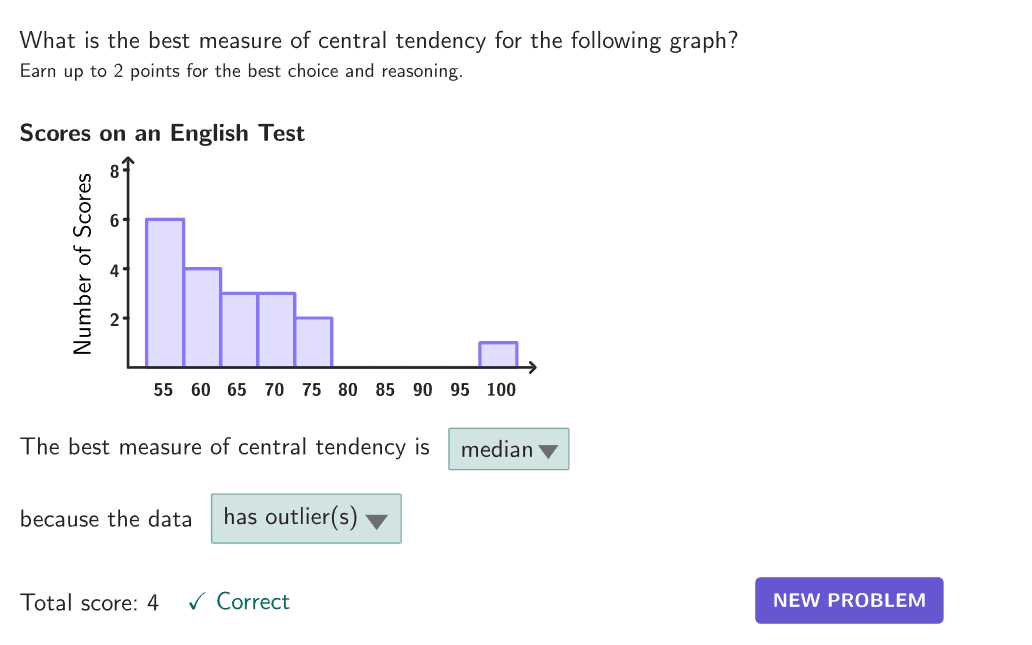
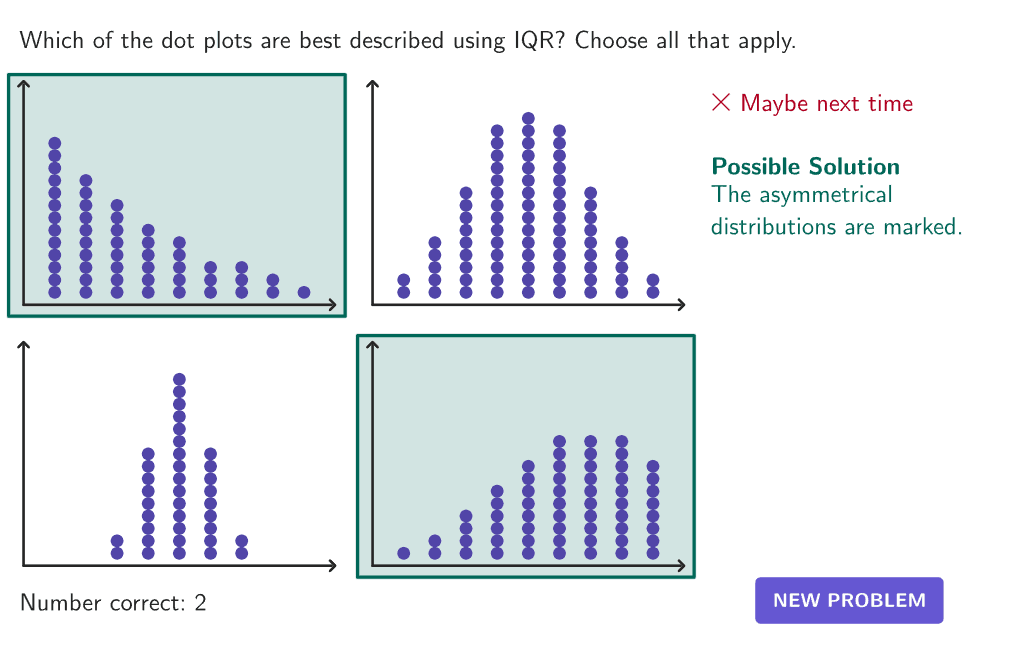
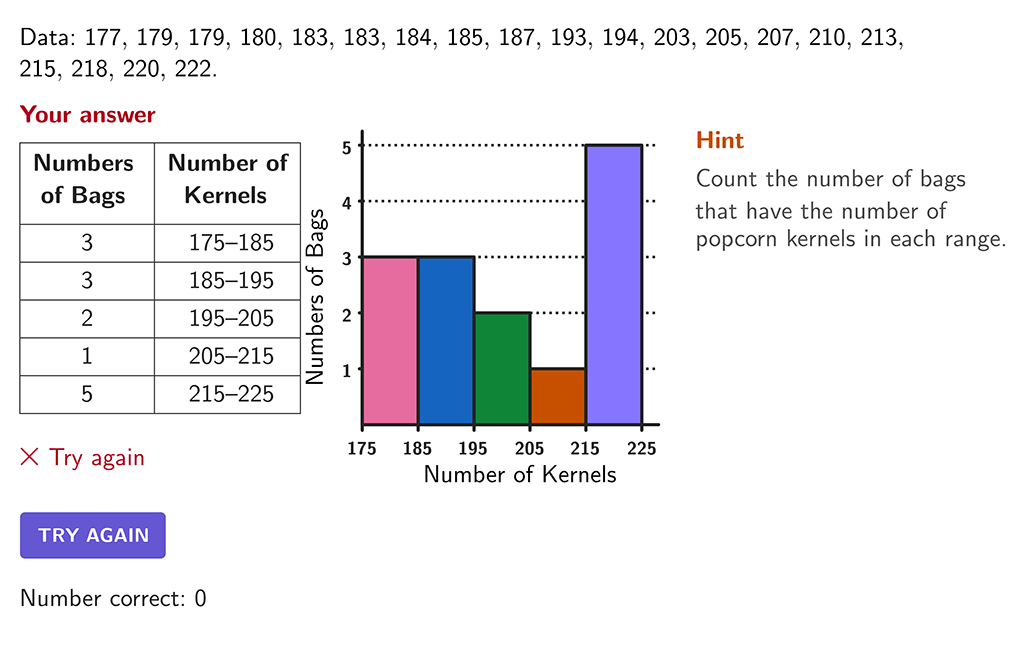
Construct a dot plot and explore the associated box-and-whisker plot. Discover connections between the data displays, measures of center, interquartile range (IQR), and descriptions.

Putting It All Together
Answer these open ended questions on your own or with others to form deeper math connections.
Open-ended question
What does a data set look like when it is symmetric? Skewed left? Skewed right?
Text and math input
Explore more
Prerequisite Resources
More from Diagrams