| | Description | Formula |
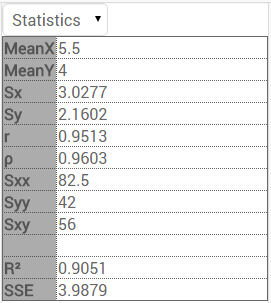
| MeanX | Calculates the arithmetic mean of the elements in the first column. | |
| MeanY | Calculates the arithmetic mean of the elements in the second column.
| |
| Sx | Calculates the standard deviation of the numbers in the first column. | |
| Sy | Calculates the standard deviation of the numbers in the second column. | |
| r | Calculates the correlation coefficient. | |
| | Calculates the Spearman's rank correlation coefficient. | |
| Sxx | Calculates the statistic value: | |
| Syy | Calculates the statistic value: | |
| Sxy | Calculates the statistic value: | |
| | Calculates the coefficient of determination.
Note: If the Regression Model is linear, then | |
| SSE | Calculates the Sum of squared errors between the y-values of the list and the function values of the x-values. | f...Regression curve
|


