IM1.5.4 Alonzo and Maria
Alonzo, Maria, and Sierra were floating in inner tubes down a river, enjoying their day. Alonzo noticed that sometimes the water level was higher in some places than in others. Maria noticed there were times they seemed to be moving faster than at other times. Sierra laughed and said “Math is everywhere!” To learn more about the river, Alonzo and Maria collected data throughout the trip.
Alonzo's Table
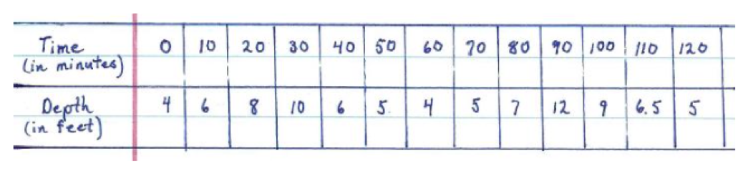
Alonzo created the table of values above by measuring the depth of the water every ten minutes. Use inequalities to answer 1 and 2: 1. Using the variable t for time, write the interval(s) where the function is increasing. 2. Write the interval(s) where the function is decreasing.
Maria's Graph
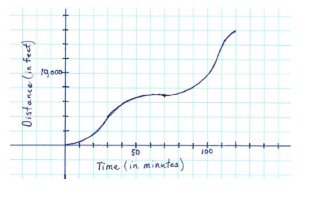
Maria created the graph above by measuring the depth of the water every ten minutes. Use inequalities to answer 1 and 2: 1. Using the variable t for time, write the interval(s) where the function is increasing. 2. Write the interval(s) where the function is decreasing.