IM2.9.1 Exit Ticket

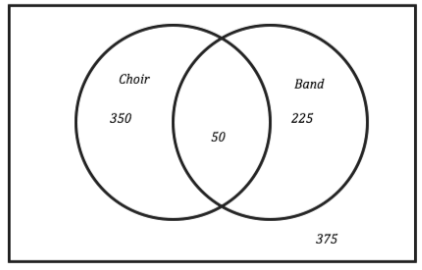
Based on the Venn Diagram above, answer the following. 1. How many students were surveyed? 2. What were the students asked? 3. How many students are in both choir and band? 4. How many students are not in either choir or band? 5. What is the probability that a randomly selected student would be in band?

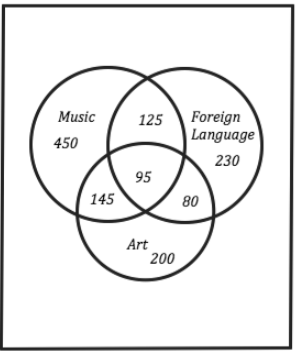
This Venn Diagram represents enrollment in some of the elective courses. 6. What does the 95 in the center tell you? 7. What does the 145 tell you? 8. How many total students are represented in the diagram? 9. Which elective class has the least number of students enrolled?

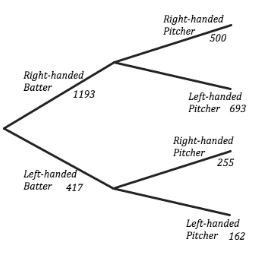
10. How many times did a batter come to the plate during this time period? 11. Based on this data, if you are a left handed batter what is the probability that you will face a right handed pitcher? 12. Based on this data, if you are a right handed batter what is the probability that you will face a left handed pitcher? 13. What is the probability that a left handed pitcher will be throwing for any given plate appearance? 14. What is the probability that a left handed batter would be at the plate for any given plate appearance? 15. What observations do you make about the data? Is there any amount that seems to be overly abundant? What might account for this?
Find the probability of achieving success with each of the events below. 16. Rolling an even number on standard six sided die. 17. Drawing a black card from a standard deck of cards. 18. Flipping a coin and getting Heads three times in a row. 19. Rolling a die and getting a four. 20. Drawing an ace from a deck of cards. 21. Rolling a die twice in a row and getting two threes. 22. From a bag containing 3 blue, 2 red, and 5 white marbles. Pulling out a red marble.