Contour
Images for the Eye & the Mind's Eye
This is a series of applets drawn from the website mathMINDhabits [sites.google.com/site/mathmindhabits]
that is designed for teachers of mathematics who want to deepen their understanding of the mathematics they teach
and that their students are expected to learn.
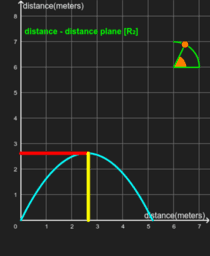
In trying to understand the nature of motion we are confronted with the problem of reconciling two profoundly different representations of reality. One representation is the path (trajectory: f(x,y,z)=c ) taken by the object in motion as it moves. The eye perceives that path and the brain "records" it. Unfortunately, the representation of the path traversed is inadequate for understanding the motion - it does not tell us where the object was at any given time nor does it tell us how fast the object was moving at any given time.
We need to complement the representing the motion by a trajectory with images that supply the missing information, i.e. graphs of position and velocity as function(s) of time [x(t), y(t), z(t), x'(t), y'(t), z'(t) ]. These images are not images that are eyes ever perceive - they are, however, needed images for the mind's eye.
Many of us have observed youngsters interpreting a rising line in a distance-time graph as "the girl climbed the hill" and a descending line on the same graph as "the girl came down the hill". College students often confuse the parabolic trajectory of a thrown football [an image for the eye] with the parabolic form of the graph of the football's height as a function of time [an image for the mind's eye].
The applets in this collection all deal with motion and are an attempt to help the user to become nimble is moving between images for the eye and images for the mind's eye.
