Google Classroom
GeoGebra
GeoGebra Classroom
登入
搜尋
Google Classroom
GeoGebra
GeoGebra Classroom
綱要
Visualizing Functions of Two Variables 1
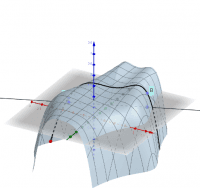
Visualizing Functions of Two Variables
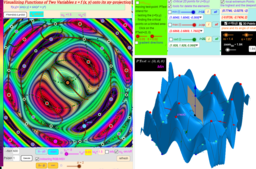
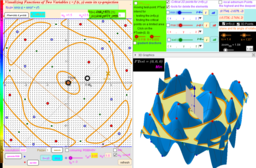
Visualizing Functions of Two Variables. Version 2
Visualizing Functions of Two Variables. Version 3
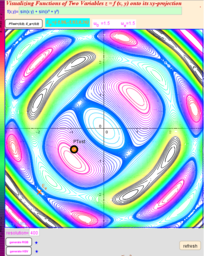
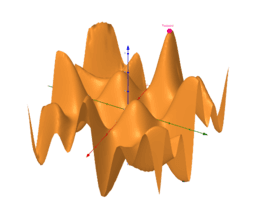
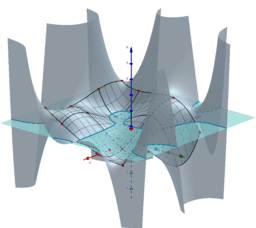
sin(x*y)+sin(x^2+y^2)- Images to Visualizing Functions of Two Variables
Visualizing Functions of Two Variables. Version 3
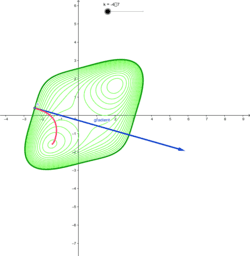
Contour Plot
Level Curves
Gradient vs. Level Curves
Funktion mit zwei Variablen
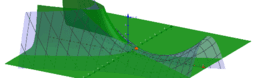
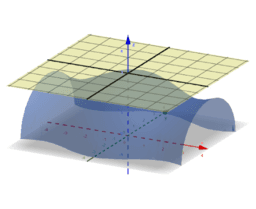
Fläche mit horizontaler Schnittebene
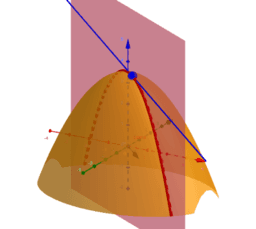
Geodäte auf einer Fläche f(x,y)
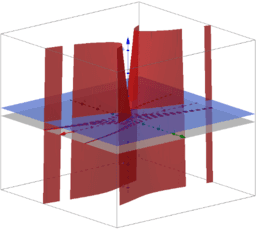
Vektorfeld eines Gradienten
勾配ベクトル場
Tribute to Hilma af Klint
Dodekaederstern
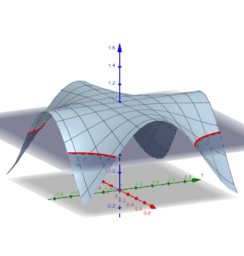
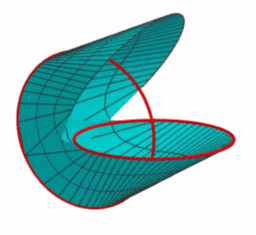
Motzkin-Fläche
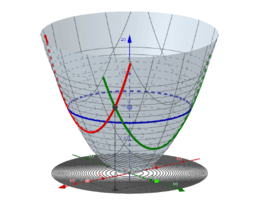
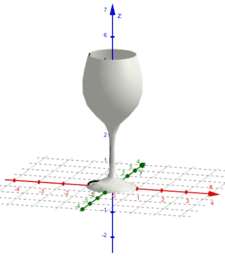
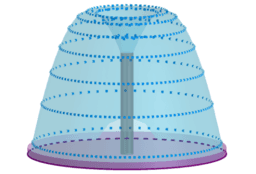
Volumen eines Weinglases
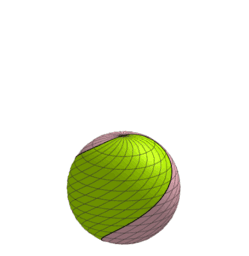
Spiral Screw Bisection of a Sphere
oloide
Directional Derivatives
Multivariable Taylor Approximation
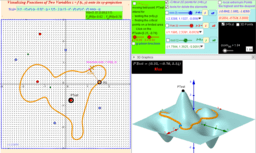
El punt de Fermat
Modelando una Fuente
Exploring functions of 2 variables
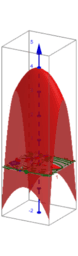
3D-Fläche mit Höhenschichtlinien
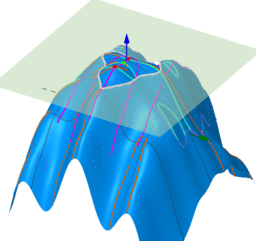
Visualizing Functions of Two Variables 1
作者:
Roman Chijner
主題:
函數
Visualizing Functions of Two Variables
Visualizing Functions of Two Variables. Version 2
Visualizing Functions of Two Variables. Version 3
sin(x*y)+sin(x^2+y^2)- Images to Visualizing Functions of Two Variables
Visualizing Functions of Two Variables. Version 3
Contour Plot
Level Curves
Gradient vs. Level Curves
Funktion mit zwei Variablen
Fläche mit horizontaler Schnittebene
Geodäte auf einer Fläche f(x,y)
Vektorfeld eines Gradienten
勾配ベクトル場
Tribute to Hilma af Klint
Dodekaederstern
Motzkin-Fläche
Volumen eines Weinglases
Spiral Screw Bisection of a Sphere
oloide
Directional Derivatives
Multivariable Taylor Approximation
El punt de Fermat
Modelando una Fuente
Exploring functions of 2 variables
3D-Fläche mit Höhenschichtlinien
下一步
Visualizing Functions of Two Variables
最新資源
apec
Weighing Scales (g): Practice
bewijs stelling van Pythagoras
seo tool
အခြေခံ data အခေါ်အဝေါ်များ
探索資源
Altitude Number 3
nyghm
Piecewise 3
Geogebra lab Oct 31
探索主題
旋轉
算術運算
積分
極限值
角度