Exploring Exponential Growth and Decay
Part 1
Below is the graph of the function f(x) = a bx. Adjust the sliders to change the values of a and b. What happens as a gets larger? As a gets smaller? As a is less than 0?
Part 2
What happens when b>1? What can you say about the behavior of the graph of exponential growth functions as x tends towards ∞? -∞?
Part 3
What happens when 0 < b < 1? What can you say about the behavior of the graph of exponential growth functions as x tends towards ∞? -∞?
Part 4:
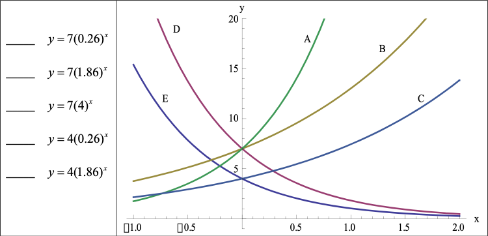
Match each function with the given graph.