Esboço
CMC-South: Visualizing the Algebra of Equations
Visualizing the Algebra of Equations with Mapping Diagrams
CMC South Annual Conference
November 6, 2021. 08:30-10:00
HIlton Plaza C
Links: https://flashman.tiny.us/CMC-SouthLinks
To have your work recorded as part of this workshop
connect to this GeoGebra book as an interactive GeoGebra class.
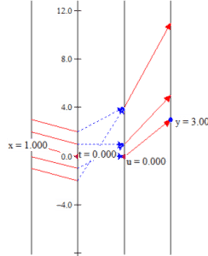
Mapping diagrams are a powerful alternative to graphs for visualizing functions and the algebra of solving equations. The workshop focus will be on visualizing the solution of linear and quadratic equations. Participants will be able to use the GeoGebra during the workshop.

Lista de conteúdos
Introduction: Backgrounds?
What is a (real) mapping diagram (MD)?
Some Historical Uses of Mapping Diagrams
MD to visualize solving linear equations.
MD to visualize solving quadratic equations.
**Optional:MD to visualize solving exponential and logarithmic equations.
**Optional: Mapping diagrams for trigonometric equations
***Optional: MD to visualize complex solutions to quadratic functions and equations.
Summary, Conclusions, References