nspire Geometry
Overview:
We took a look at the Geometry section of the nspire calculator. We went from a circle to a graph through various techniques of the nspire. The technology is amazing in the fact that this can all be done on one piece of technology is something unheard of.
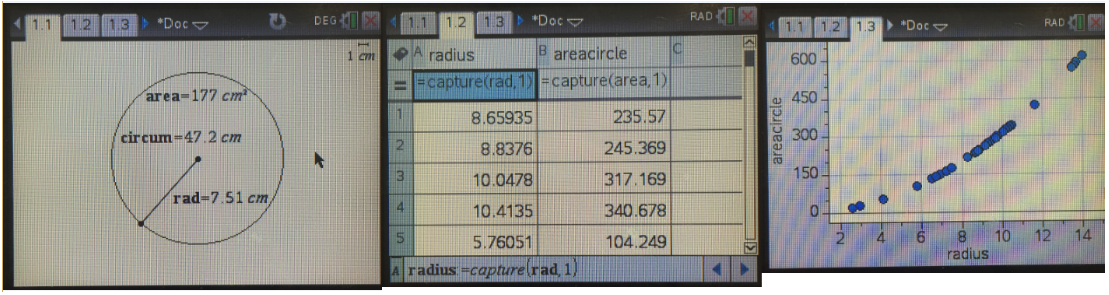
As shown above, there were 3 pages to this document.
First, we had to create the circle and find the radius, area, and circumference.
Then, we input this data into a spreadsheet with the correct variables from the circle.
Lastly, we graphed the radius vs. the area of the circle to create a function with various points.
10C
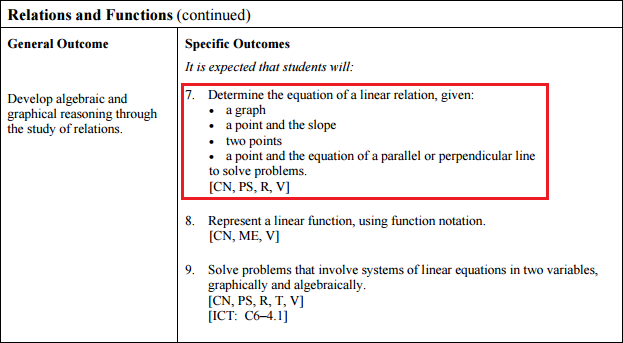
This corresponds to the 10C Relations and Functions curriculum specifically number 7. Students need to determine the equation of a graph given a graph, points, an slope to solve problems.
Students are required to:
- Determine the slope and y-intercept of a given linear relation from its graph, and write the equation in the form y = mx + b.
- Write the equation of a linear relation, given its slope and the coordinates of a point on the
line, and explain the reasoning.
- Write the equation of a linear relation, given the coordinates of two points on the line, and
explain the reasoning.
- Write the equation of a linear relation, given the coordinates of a point on the line and the
equation of a parallel or perpendicular line, and explain the reasoning.
- Graph linear data generated from a context, and write the equation of the resulting line.
- Solve a problem, using the equation of a linear relation.
Sample Questions:
Grade 10:
Get the students to build a shape in the geometry section and get them to go through the same process as above to graph a function.
Conclusion
I like this problem, but sometimes the technology with the nspire can be a bit touchy. Sometimes the center button won't work and it gets confusing. The concepts related to it though is extremely helpful and important. I liked the flow from the geometry to the spreadsheet to the graph, it was seamless and efficient.