Spreadsheet Perspective
The  Spreadsheet Perspective includes the Spreadsheet View and the
  Graphics View. By default, the
 coordinate axes are shown in the Graphics View.
Note: Depending on which of these Views is activated, either the Graphics View Toolbar or the Spreadsheet View Toolbar are shown and the
coordinate axes are shown in the Graphics View.
Note: Depending on which of these Views is activated, either the Graphics View Toolbar or the Spreadsheet View Toolbar are shown and the 
 Undo / Redo buttons are in the top right corner.
Spreadsheet Perspective includes the Spreadsheet View and the Graphics View. By default, the
coordinate axes are shown in the Graphics View.
Note: Depending on which of these Views is activated, either the Graphics View Toolbar or the Spreadsheet View Toolbar are shown and the Undo / Redo buttons are in the top right corner.The Spreadsheet View
The Spreadsheet View is an interactive spreadsheet connected with some of the other Views of GeoGebra (e.g. the
Graphics View). Every cell has a specific name, that allows you to directly address each one.
Example: The first cell in column A is named A1.
Note: These cell names can be used in expressions and commands to address the content of the corresponding cell.
In the Spreadsheet cells you can enter not only numbers, but all types of general and geometrical objects that are supported by GeoGebra (e. g., coordinates of points, functions, commands).
Note: If you copy content from one cell to another, by default all references are changed accordingly to the target position.
Spreadsheet View is an interactive spreadsheet connected with some of the other Views of GeoGebra (e.g. the
Graphics View). Every cell has a specific name, that allows you to directly address each one.
Example: The first cell in column A is named A1.
Note: These cell names can be used in expressions and commands to address the content of the corresponding cell.
In the Spreadsheet cells you can enter not only numbers, but all types of general and geometrical objects that are supported by GeoGebra (e. g., coordinates of points, functions, commands).
Note: If you copy content from one cell to another, by default all references are changed accordingly to the target position.Task
Get in touch with the Spreadsheet Perspective by following the instructions below.
Spreadsheet Perspective by following the instructions below.Instructions
| 1. | 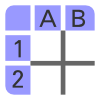 | In the Spreadsheet View, enter the following data values into the cells of column A: A1: 1 A2: 2
|
| Hint: Always evaluate your input by hitting the Enter key. | ||
| 2. | | Relative copy the content of cells A1 and A2 to the cells A3 to A6. |
| | Hint: Select cells A1 and A2. Drag the right lower corner of the highlighted cells down to cell A6 to continue the number sequence. | |
| 3. | | Enter the following data values into the cells B1 to B6: 2, 1, 2, 3, 5, 4
|
| 4. |  | Highlight all cells that contain any content, and select the List of Points tool. In the appearing dialog click Create. |
| | | Hint: Your cell entries are now used to create points in the Graphics View, using the values in column A for their x-coordinates, while the values of column B determine the y-coordinates.
|