Data Activity
Information
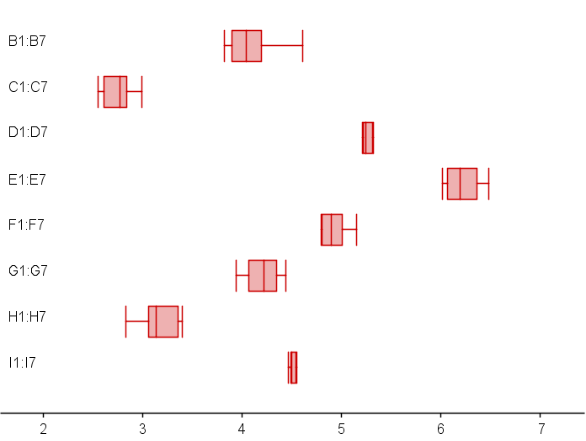
Provided below, there are scores on the quality of math and science education in eight different countries. The scores range from one to seven, with seven being the highest level of quality.
Data comes from the World Economic Forum.
Means
Find all the countries means. Which one is the highest? Which one is the lowest?
Ranges
a. Which country has the greatest positive change? b. Which country has the greatest negative change? c. Which country has the least amount of change (positive or negative)?
Analysis
Choose a country and create a story about the change in scores over the years.
Graph

Graph Analysis
Above are box and whisker plots of the data. State 3 facts about the plots.