Google Classroom
GeoGebra
GeoGebra Classroom
Sign in
Search
Google Classroom
GeoGebra
GeoGebra Classroom
Outline
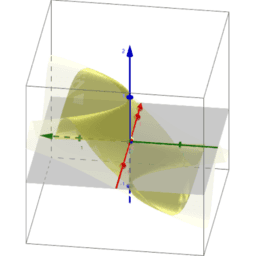
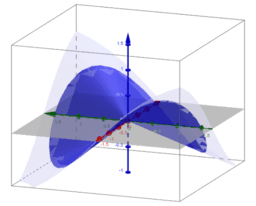
Visualization of limits of functions of two variables
Introduction
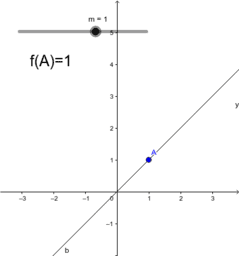
Example 1
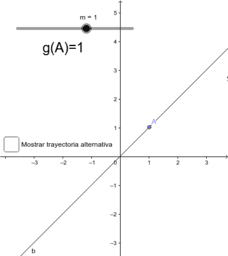
Example 2
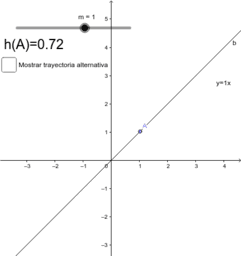
Example 3
Polar coordinates: Example 1
Polar coordinates: Example 2
Polar coordinates: Example 3
Thank you very much
Visualization of limits of functions of two variables
Author:
Laura del Río
Topic:
Functions
,
Limits
Presentation for sharing at the GeoGebra Global Gathering 2017
Introduction
Example 1
Example 2
Example 3
Polar coordinates: Example 1
Polar coordinates: Example 2
Polar coordinates: Example 3
Thank you very much
Next
Introduction
New Resources
Solving 2x2 and 3x3 Systems Using Cramer's Rule
Isosceles Triangle Cross Sections
Semicircular Cross Sections
רישום חופשי
seo tool
Discover Resources
Transformation from a Cube to a Rhombic Triacontahedron
Trapesium
Zadatak - Prizma 3
Geometrical Interpretation of (a+b)^2
Τριγωνομετρικοί Άξονες
Discover Topics
Congruence
Surface
Sine
Piecewise Functions
Median Line