Google Classroom
GeoGebra
GeoGebra Classroom
Anmelden
Suche
Google Classroom
GeoGebra
GeoGebra Classroom
Kapitel
Contour Plots
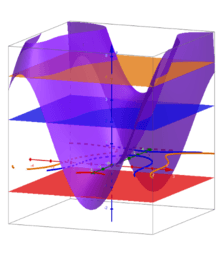
Contour plot and surface
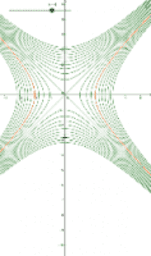
Function of several variables: several level curves
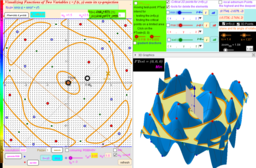
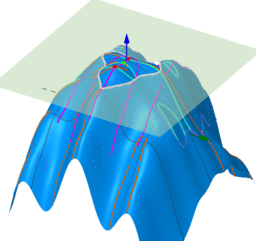
sin(x*y)+sin(x^2+y^2)- Images to Visualizing Functions of Two Variables
Visualizing Functions of Two Variables. Version 3
Contour Plots
Autor:
Edward Wicks
Contour plot and surface
Function of several variables: several level curves
sin(x*y)+sin(x^2+y^2)- Images to Visualizing Functions of Two Variables
Visualizing Functions of Two Variables. Version 3
Weiter
Contour plot and surface
Neue Materialien
Slopes of Perpendicular Lines
Open Education 2025
Slopes of Parallel Lines
z`]]
Similar Solids
Entdecke Materialien
Concurrent Points in Triangles
Toucan 2.0
รูปคลี่ของพีระมิดฐาน
Množina středů všech kružnic, které se dotýkají dvou kružnic stejného poloměru.
Mystery shape
Entdecke weitere Themen
Sekante
Geometrisches Mittel
Trigonometrie
Einheitskreis
Quadratische Funktionen