Google Classroom
GeoGebra
Classe GeoGebra
Se connecter
Chercher
Google Classroom
GeoGebra
Classe GeoGebra
Contour
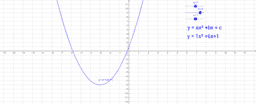
Quadratics
Graph y=x^2 + c
Quadratics
Auteur :
Jean Maxstadt
Explore how the values of a, b, and c affect the graph.
Graph y=x^2 + c
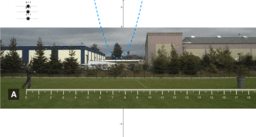
Ball in Can - Photo A
Explore how the values of a, b and c affect quadratic graph
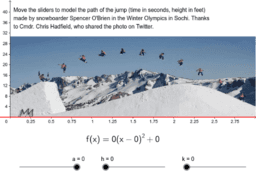
Olympic Quadratic Modeling with Sliders
Suivant
Ball in Can - Photo A
Nouvelles ressources
အခြေခံ data အခေါ်အဝေါ်များ
Kopie von Exact values on the unit circle (degrees)
Square Cross Sections
Rectangular Cross Sections
Tanzanian Ngoma - Model 1
Découvrir des ressources
Mingtao
Optimization: Area of a Rectangle
Chebyshev-like N=3 Polygon Wheel (Official ver.-B)
Pythagoras tree Affine
Multiplying a Fraction by a Fraction
Découvrir des Thèmes
Dérivée
Moyennes
Valeur Attendue
Vecteurs
Logarithme