Google Classroom
GeoGebra
GeoGebra Classroom
Abrir sesión
Buscar
Google Classroom
GeoGebra
GeoGebra Classroom
Esquema
Estatística
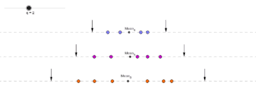
Statistical Outliers Impossible in Small Samples
Outlier Influence
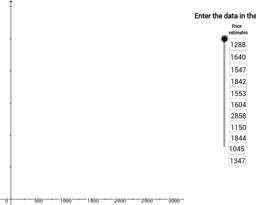
Estimate using Box Plot
Outliers
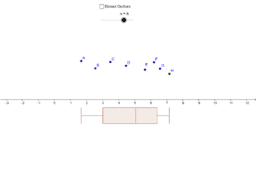
Dynamic Boxplot
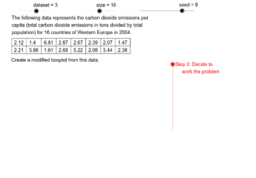
Step Through Modified Boxplot Construction
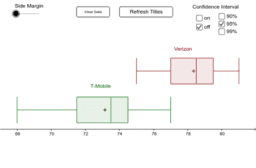
Generate Two Boxplots
Boxplot Game
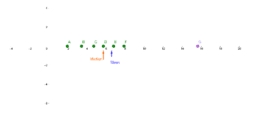
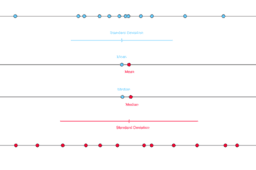
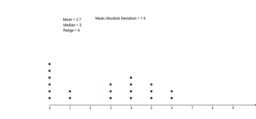
Mean, Median, and Standard Deviation
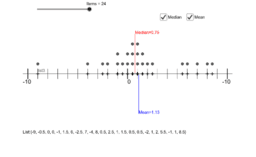
Dot Plot Interactive
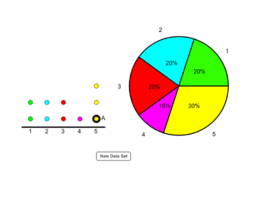
AQR Section 16: Creating a Pie Chart From a Dot Plot
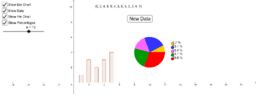
Bar Charts and Pie Charts
Dot Plot Tool
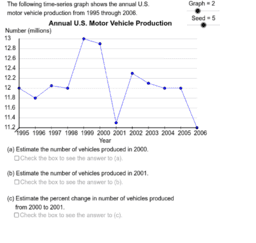
Time Series Analysis Problems
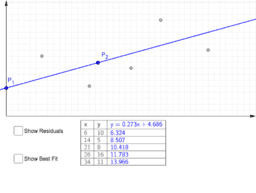
Least Squares Demonstration
Estatística
Autor:
Palmerim
Statistical Outliers Impossible in Small Samples
Outlier Influence
Estimate using Box Plot
Outliers
Dynamic Boxplot
Step Through Modified Boxplot Construction
Generate Two Boxplots
Boxplot Game
Mean, Median, and Standard Deviation
Dot Plot Interactive
AQR Section 16: Creating a Pie Chart From a Dot Plot
Bar Charts and Pie Charts
Dot Plot Tool
Time Series Analysis Problems
Least Squares Demonstration
Siguiente
Statistical Outliers Impossible in Small Samples
Nuevos recursos
Calculando distâncias
klein
Resolvendo equações do 2º Grau no Graspable
Graspable e GeoGebra
gear DL
Descubrir recursos
Aula 10 ex4
cubo
Cossenos Diretores
Autovalores e Autovetores
valentina xande-9E-F37
Descubre temas
Raíz
Porcentajes
Vectores 3D (tres dimensiones)
Diagramas
Paralelepípedo