Google Classroom
Google Classroom
GeoGebra
GeoGebra Classroom
Sign in
Search
Google Classroom
Google Classroom
GeoGebra
GeoGebra Classroom
Outline
Statistics
Box Plot
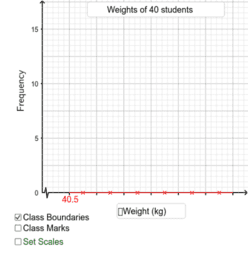
Drawing Histograms
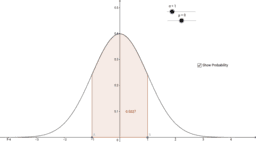
Altering the standard deviation and mean of the normal curve
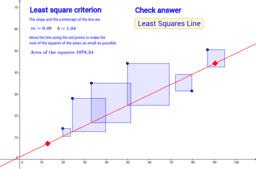
Least Squares Criterion
Statistics
Author:
Dr. Edgar
Box Plot
Drawing Histograms
Altering the standard deviation and mean of the normal curve
Least Squares Criterion
Next
Box Plot
New Resources
רישום חופשי
apec
The Datasaurus Dozen
Visualizing the Pythagorean Identity with Sine and Cosine
From Polar to Cartesian Coordinates
Discover Resources
正方形與菱形
Friendship 1
Новый год Роберт Унт
Penrose big and small
Bellwork Unit 3
Discover Topics
Mathematics
Logarithm
Percentages
Geometric Mean
Upper and Lower Sum or Riemann Sum