Google Classroom
Google Classroom
GeoGebra
Classe GeoGebra
Se connecter
Chercher
Google Classroom
Google Classroom
GeoGebra
Classe GeoGebra
Contour
S2,3,5 Statistics
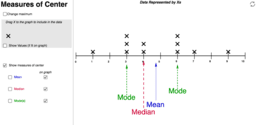
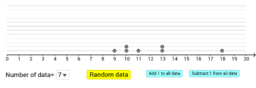
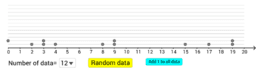
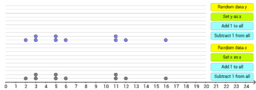
Measures of Center - Dot Plot
Measures of Central Tendency 集中趨勢的量度
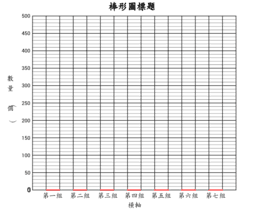
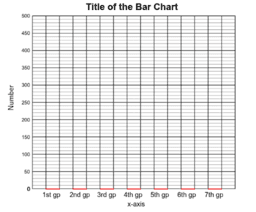
棒形圖製作器
Bar Chart Plotter
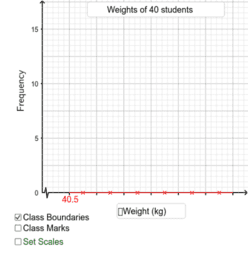
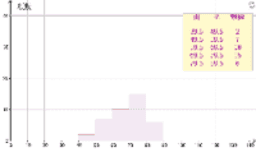
製作組織圖
Drawing Histograms
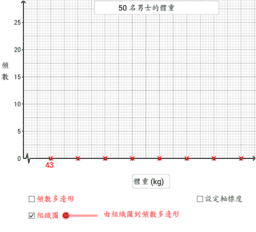
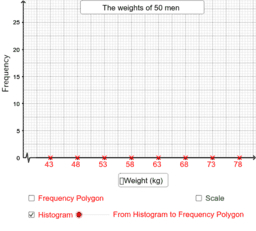
由組織圖到頻數多邊形
From Histograms to Frequency Polygons
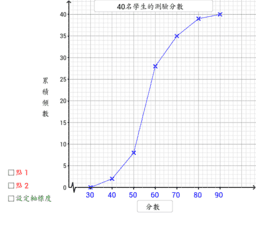
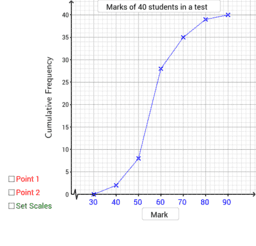
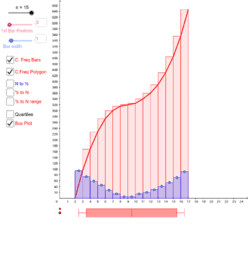
累積頻數多邊形的應用
Cumulative Frequency Polygon
累積頻數多邊形
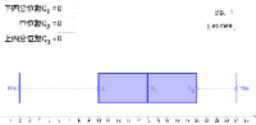
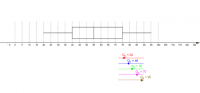
Quartiles and Box Plot (one data set) 四分位數與框線圖(一組數據)
Quartiles and Box Plot (two data sets) 四分位數與框線圖(比較兩組數據)
Quiz on Quartiles and Box Plot 四分位數與框線圖:測驗
Cumulative Frequency Properties
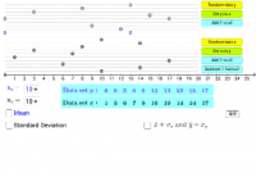
Standard Deviation (two data sets) 標準差(比較兩組數據)
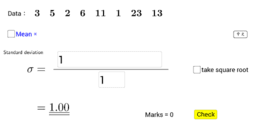
標準差:測驗
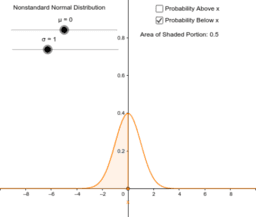
Standardizing the Normal Distribution
Box and Whisker plot
S2,3,5 Statistics
Auteur :
tkyggb
Thème :
Histogramme
,
Statistiques
S2 Statistics, Histogram, Frequency Polygon, Frequency Curve, Cumulative Frrequency
Measures of Center - Dot Plot
Measures of Central Tendency 集中趨勢的量度
棒形圖製作器
Bar Chart Plotter
製作組織圖
Drawing Histograms
由組織圖到頻數多邊形
From Histograms to Frequency Polygons
累積頻數多邊形的應用
Cumulative Frequency Polygon
累積頻數多邊形
Quartiles and Box Plot (one data set) 四分位數與框線圖(一組數據)
Quartiles and Box Plot (two data sets) 四分位數與框線圖(比較兩組數據)
Quiz on Quartiles and Box Plot 四分位數與框線圖:測驗
Cumulative Frequency Properties
Standard Deviation (two data sets) 標準差(比較兩組數據)
標準差:測驗
Standardizing the Normal Distribution
Box and Whisker plot
Suivant
Measures of Center - Dot Plot
Nouvelles ressources
兩組對邊相等的四邊形
拼砌四邊形
【案例】2018年全国1卷理科12题
柱體建築師
画直线等分三角形的面积
Découvrir des ressources
底數小於1的指數變化
正弦公式證明 (Mr. KONG)
gjc090c23 圓內三角形與角度
Statistical calculator 2
幂函数
Découvrir des Thèmes
Fonctions Trigonométriques
Périmètre
Pythagore ou Théorème de Pythagore
Pavé Droit
Equations