Model is to Data as Chicken is to Egg
Model is to data as chicken is to egg - an essay for students on formulating models
If we have a collection of pieces of aluminum and a collection of pieces pine and a collection of pieces of polystyrene most people would be willing to agree that there is some property of aluminum that is “larger” than that of pine. Suppose, for the moment, we call this property “oomph”.
Is there some way we can pin down what such a property called “oomph” might be? More to the point, is there some way we can say whether the “oomph” of some third material like polystyrene is closer to the “oomph” of aluminum than it is to the “oomph” of pine? And if so, how much closer?
More generally, if we a bunch of different materials, can we find a way to order them according to the “oomph” property – from the “largest” to the “smallest”?
First thoughts would suggest that the relevant property of the aluminum pieces, the pine pieces and the polystyrene pieces that we want to pay attention to is how “big” they are. But by “big” we might mean their physical size (volume – amount of space they take up) or we might mean their weight (or their mass). Clearly each piece of aluminum, pine and polystyrene has both a volume and a mass.
Assuming we have the proper instruments for measuring volume and mass, we could measure both the volume and the mass for each of the pieces of aluminum, pine and polystyrene. If we do so, we will quickly discover that our mystery property, “oomph”, cannot be mass and it cannot be volume. We can find some pieces of pine with more mass than pieces of aluminum and some pieces of pine with less mass than pieces of aluminum.
If we try to organize our data we might make a table something like this:
[Note that for each material we have included the data point volume = 0 cc corresponding to mass = 0 gm. This is because if an object has not mass it takes up no space.]
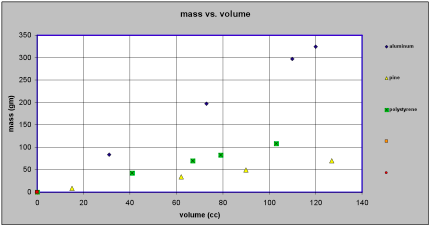
Or we might plot our points on graph paper something like this: [see figure 1]
Data in tables (symbols) and graphs (images)
It is important to stress that at this point all we have done is to record our data. We have used two different but equivalent representations, one involving symbols (tables) and the other involving images (graphs). Neither representation is more fundamental than the
other. The table records our data in a way that makes the precision of our measured numbers clear. However, it does not make salient whether the masses or the volumes are close to one another or not. The graph, on the other hand, typically does not allow us to read the values of our measurements to the same degree of precision as the table. It does, however, show us whether data points are close to or far apart from one another and it does suggest patterns and regularities that may be present in the table but not apparent.
The only “modeling” we have done is to assume that somehow our mystery property “oomph” can be related in some way to either the mass of and object or its volume or both.
But we have ruled out the possibility of “oomph” depending on mass only or “oomph” depending on volume only.
Looking at our data in graphical form suggests a model. By model in this we mean a recipe or a prescription for predicting the mass of an object if we know its volume or predicting the volume of an object if we know its mass. For example, the highway department may know that a truck can hold 10 cubic meters but needs to know what is the mass of a full load of sand and has no tools for measuring that large a mass of sand, or almond thieves may need to know how large a container they need in order to pack up and get away with 1000 kilograms of almonds. What model do the data suggest?
We can reason from either the table of measurements or the graph of the measured values.
On our table of measured values we see that a 120 cc piece of aluminum has a mass of 324 gm. We might reasonably expect that a 240 cc [2 x 120 cc] piece of aluminum would have a mass of 648 gm [2 x 324 gm] and that a 360 cc [3 x 120 gm] piece of aluminum would have a mass of 972 gm [ 3 x 324 gm].
On our graph of measured values we see that all the points we measured for aluminum seem to lie on a straight line. All the points we measured for pine also seem to lie on a line, albeit a different line. And all the points measured for polystyrene seem to lie on a third line.
We can capture this pattern of regularity in a mathematical relationship that says that
| material 1 | aluminum | material 2 | pine | material 3 | polystyrene | ||
| volume (cc) | mass (gm) | volume (cc) | mass (gm) | volume (cc) | mass (gm) | ||
| 0 | 0 | 0 | 0 | 0 | 0 | ||
| 120 | 324 | 15 | 8.3 | 41 | 43.1 | ||
| 73 | 197 | 62 | 34.1 | 103 | 108.2 | ||
| 31 | 83.7 | 127 | 69.9 | 79 | 83 | ||
| 110 | 297 | 90 | 49.5 | 67 | 70.4 |
mass is proportional to volume.
This is the model that we will assume. The model in symbols If we try to express this mathematical model in symbols we can write for aluminum mass (in gm) = 2.7 x volume (in cc) and for pine mass (in gm) = 0.55 x volume (in cc) and for polystyrene mass (in gm) = 1.05 x volume (in cc) This pattern suggests that the quantities 2.7 gm/cc, 0.55 gm/cc and 1.05 gm/cc somehow characterize the materials aluminum, pine and polystyrene respectively. Could these quantities be a measure of the mystery property “oomph”? Suppose we use a symbol like the letter d to stand for the quantity that characterizes the material. Then we can write our mathematical model in symbols more generally asmass = d x volume or m = d x v
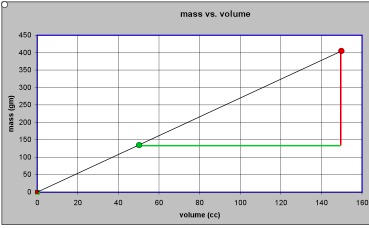
If mass is measured in grams and volume is measured in cc then d must be in gm/cc. The model in images We can also try to express our model in images as suggested by the graph representation of our data. Our plotted data suggest that object made of a given material will have masses and volumes that are related in such a way that they will lie on a straight line [that goes through the point mass = 0, volume = 0 ] when plotted in a Mass vs. Volume graph. Clearly what characterizes a given material is the slope of that line. The line for aluminum climbs faster than the line for pine – and we say that that line has a greater slope. People who build roofs on houses, install plumbing pipes or handicap access ramp all measure slope in the same way. They ask “how much does the {roof, pipe, ramp} rise for every unit of horizontal run of the {roof, pipe, ramp}? The amount of rise divided by the amount of run is a measure of the slope. Suppose we have two aluminum objects [the green dot and the red dot in the graph], one having a volume that is 100 cc greater than the other. Our model tells us that because they are made of the same material their data points will lie on the same straight line. To get from the green dot to the red dot we have to run horizontally 100 cc and then rise vertically 270 gm. Another way of saying this is that we have to rise vertically 2.7 gm for every horizontal run of 1 cc. The slope of our aluminum line is 2.7 gm/cc [see figure 2] Coming from our model expressed in graphical form, the quantity that expresses the characteristic property of the material is the slope of the line that corresponds to that material. How does our model expressed in graphical form correspond to our model expressed in symbolic form? In the symbolic form of our model, which says “mass is proportional to volume” , the quantity that characterizes the material we have in mind is the quantity that multiplies the volume to yield the mass. In the graphical form of our model, the quantity that characterizes the material we have in mind is the quantity that measures the slope of the line for that material. These are two representations of the same quantity – the density of the material. The Bottom Line We start with some initial notions about what quantities might be important enough in a given situation to warrant our collecting data. We can organize our collected data in different ways. Moreover, the collected data may lead us to propose a model which allows us to predict the result of as yet unmade measurements. Needless to say, we must then collect more data to see if the predictions of our model are upheld. This activity may lead us to refine our model. So here is something to think about – do you really believe that no matter how small a piece of aluminum you take the mass of the piece of aluminum in grams is 2.7 times the volume of that piece of aluminum in cc? It really seems to work over a very wide range of values – but suppose we start to get to sizes that are comparable to the sizes of atoms? Or smaller?figure 1

figure 2
