Google Classroom
GeoGebra
GeoGebra Classroom
Sign in
Search
Google Classroom
GeoGebra
GeoGebra Classroom
Outline
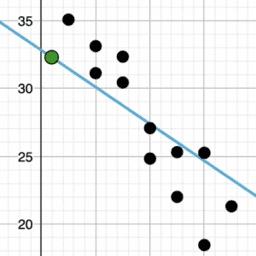
Describing Trends in Scatter Plots: IM 8.6.5
Lesson 8.6.5
Practice 8.6.5
Describing Trends in Scatter Plots: IM 8.6.5
Author:
GeoGebra Classroom Activities
,
IM 6 – 8 Math
Topic:
Algebra
,
Correlation
,
Equations
,
Linear Equations
,
Linear Regression
,
Scatter Plot
,
Statistics
“Describing Trends in Scatter Plots”
from IM Grade 8 by
Open Up Resources
and Illustrative Mathematics. Licensed under the
Creative Commons Attribution 4.0 license
.
Table of Contents
Lesson 8.6.5
IM 8.6.5 Lesson: Describing Trends in Scatter Plots
Practice 8.6.5
IM 8.6.5 Practice: Describing Trends in Scatter Plots
Next
IM 8.6.5 Lesson: Describing Trends in Scatter Plots
New Resources
Taylor Polynomial
alg2_05_05_01_applet_exp_flvs
Poorly Drawn Parallelograms 2
alg2_05_05_01_applet_exp_2_flvs
Quiz: Finding Average Rate of Change
Discover Resources
foro circunf tang inter a elipse y ejes
ಕೋ ಬಾ ಕೋ ಸರ್ವಸಮತೆ ನಿಯಮ
Circle-wave
MODUL 10 E_RR. KUNTIE_7A_SMPN 1 LASEL
Introduction to the Derivative
Discover Topics
Kite
Random Experiments
Upper and Lower Sum or Riemann Sum
Rhombus
Stochastic Process or Random Process