Google Classroom
GeoGebra
GeoGebra Classroom
Sign in
Search
Google Classroom
GeoGebra
GeoGebra Classroom
Outline
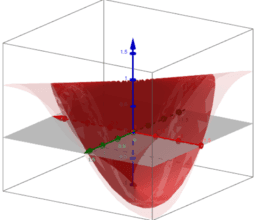
Visualization of limits of functions of two variables
Introduction
Example 1
Example 2
Example 3
Polar coordinates: Example 1
Polar coordinates: Example 2
Polar coordinates: Example 3
Thank you very much
Visualization of limits of functions of two variables
Author:
Laura del Río
Topic:
Functions
,
Limits
Presentation for sharing at the GeoGebra Global Gathering 2017
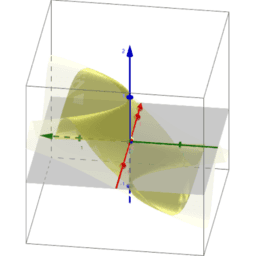
Introduction
Example 1
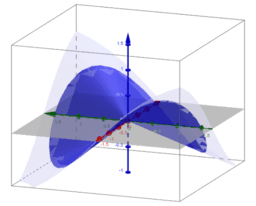
Example 2
Example 3
Polar coordinates: Example 1
Polar coordinates: Example 2
Polar coordinates: Example 3
Thank you very much
Next
Introduction
New Resources
Average Rate of Change: Graph a Function (1)
Icosahedron1
Exploring the Derivative of a Quadratic Function
Construct a Conic
Variation Theory Parallelogram Proofs
Discover Resources
Test applet number 2!
Centroid
Finding the Midpoint of a Radius
نشاط 2
Domain & Range: Illustrated v2
Discover Topics
Straight Lines
Distributions
Conditional Probability
Median Value
Statistics